Available Charts
Active Trials
The Active Trials chart shows the active trial subscriptions for the selected dates. The chart also shows the segmentation of active trials by their auto-renew state. The chart’s title shows your active trials at the end of the selected period; the percentage shows how this number changed during the period chosen. In the example below, for the 30th of June, you have 461 active trial subscriptions, which is 18.23% higher than you had for the 1st of June.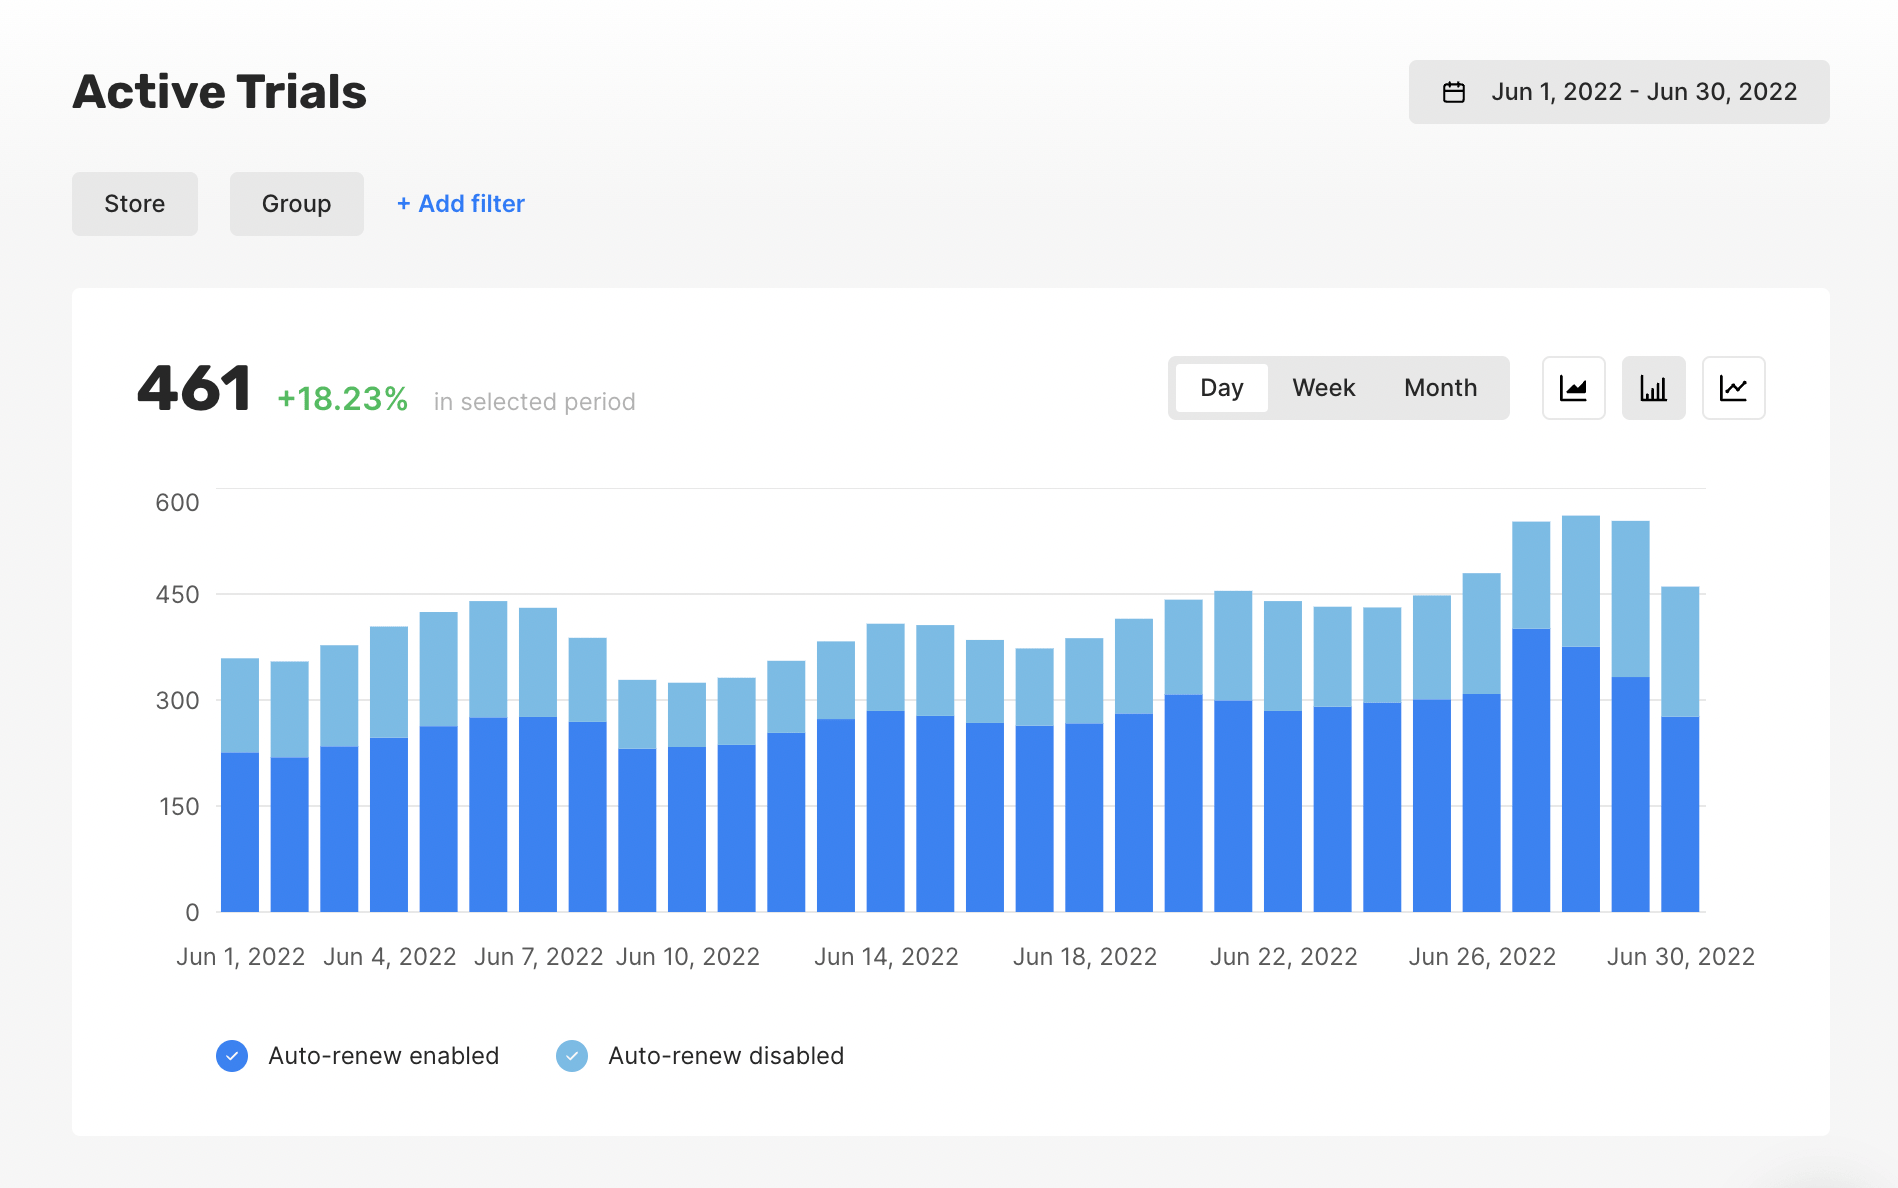
Active Trials - Mobile Analytics - Qonversion
New Trials
The number of trial start events for the period chosen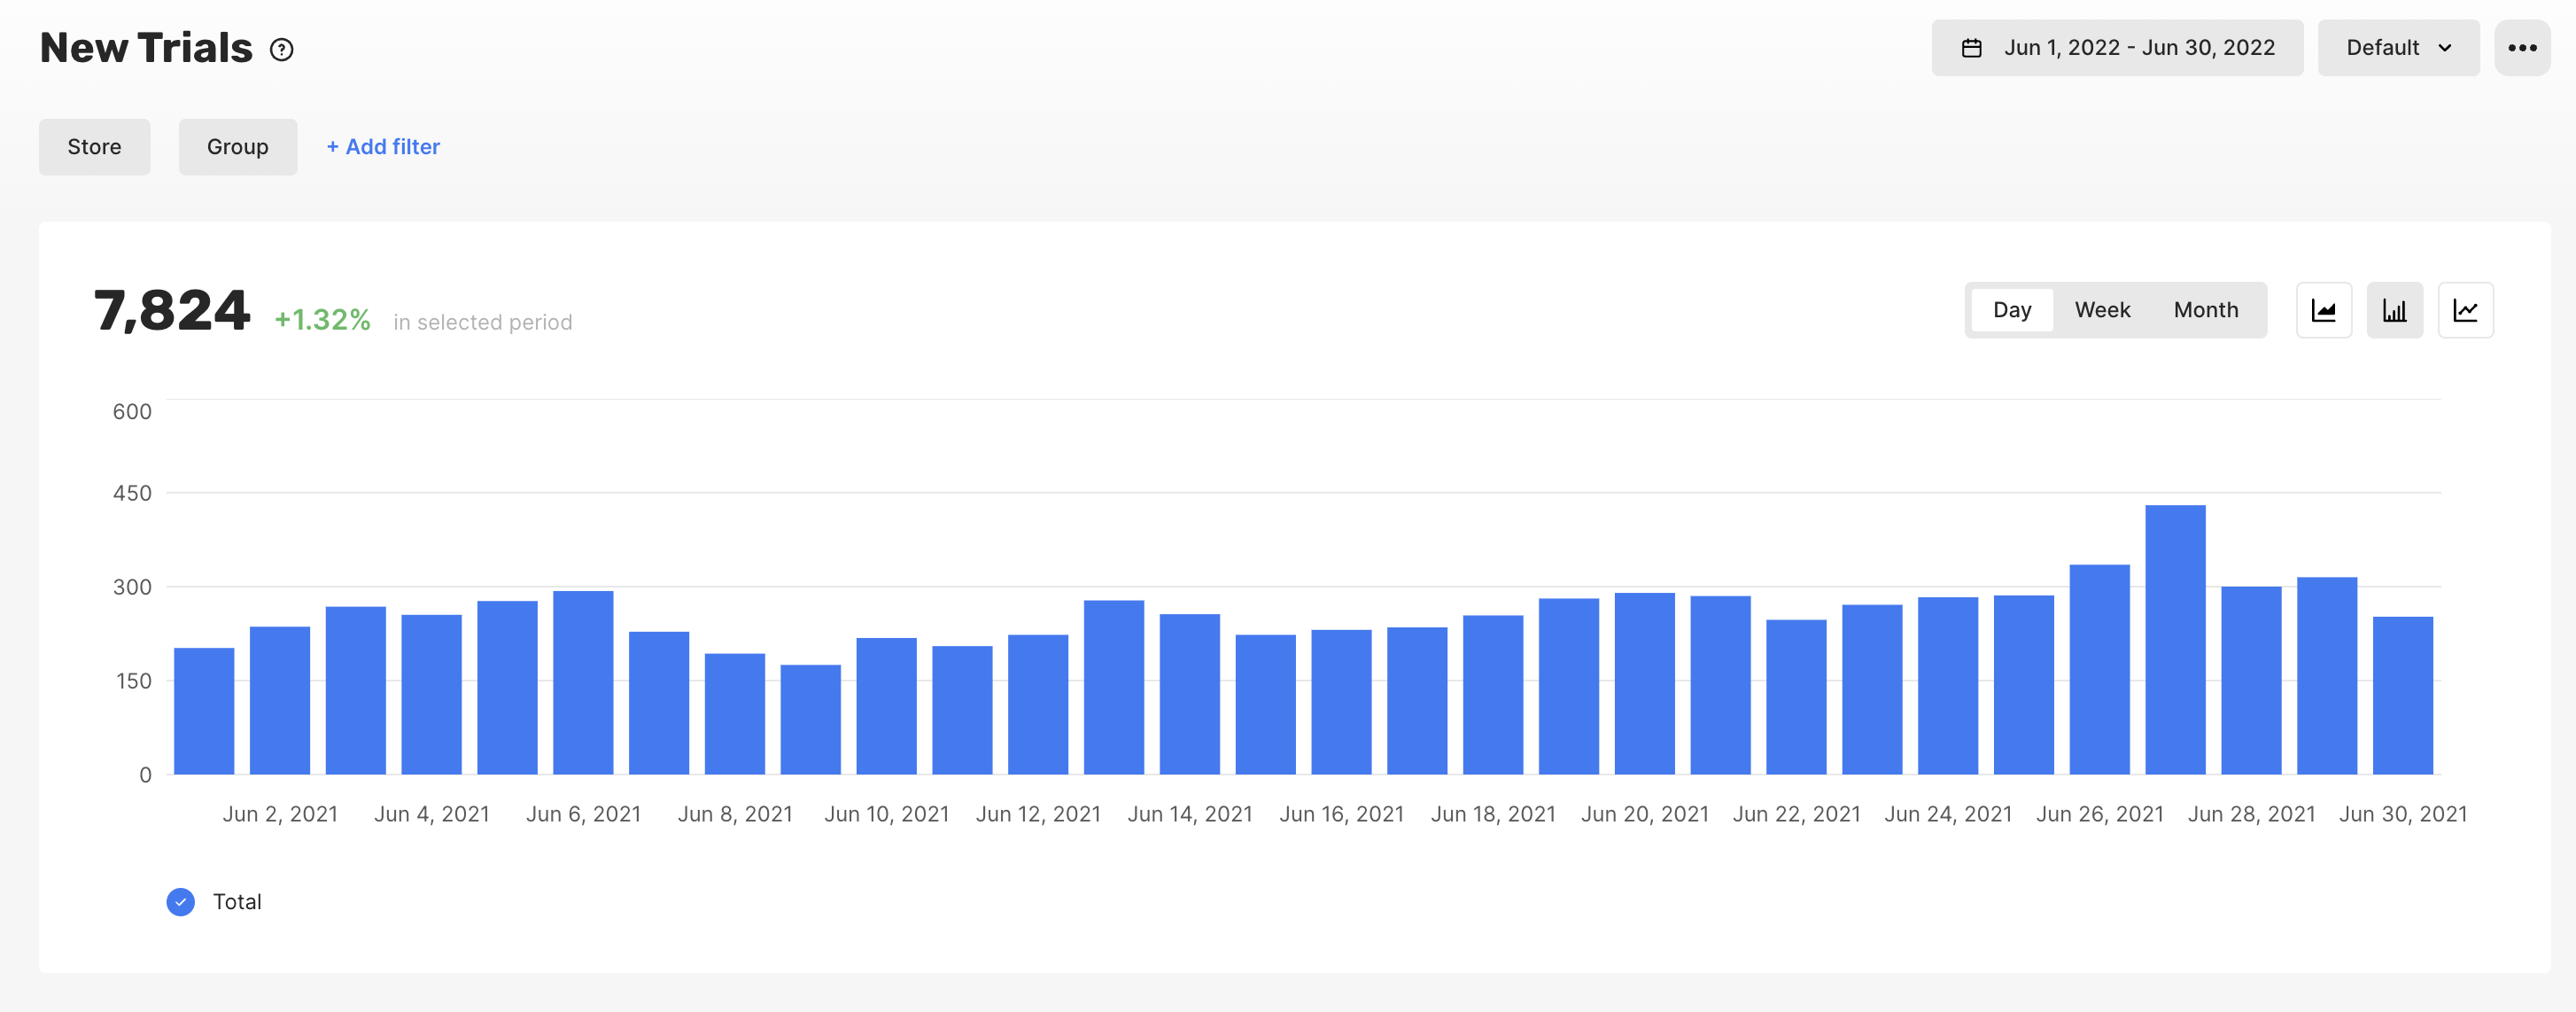
Trials - Mobile Analytics - Qonversion
Trials Movement
The Trials Movement chart helps you understand how your trial subscriptions base changes over time. This chart includes the increase in the trial subscriptions (above zero; trial started events) and trials expired (below zero; trial expired events). When a user cancels a trial, it means that a user turns off auto-renewal. This trial is still active (the user has access to premium features) till the trial expiration date. The chart’s title shows the net number of trial subscriptions during the selected period; the percentage shows how this value changed compared to the previous period of the same length. In the example below, from the 1st of June until the 30th of June, your trial subscription base had increased by 2,332 trial subscriptions, which is 1.66% higher than your growth in the previous period of the same length (30 days).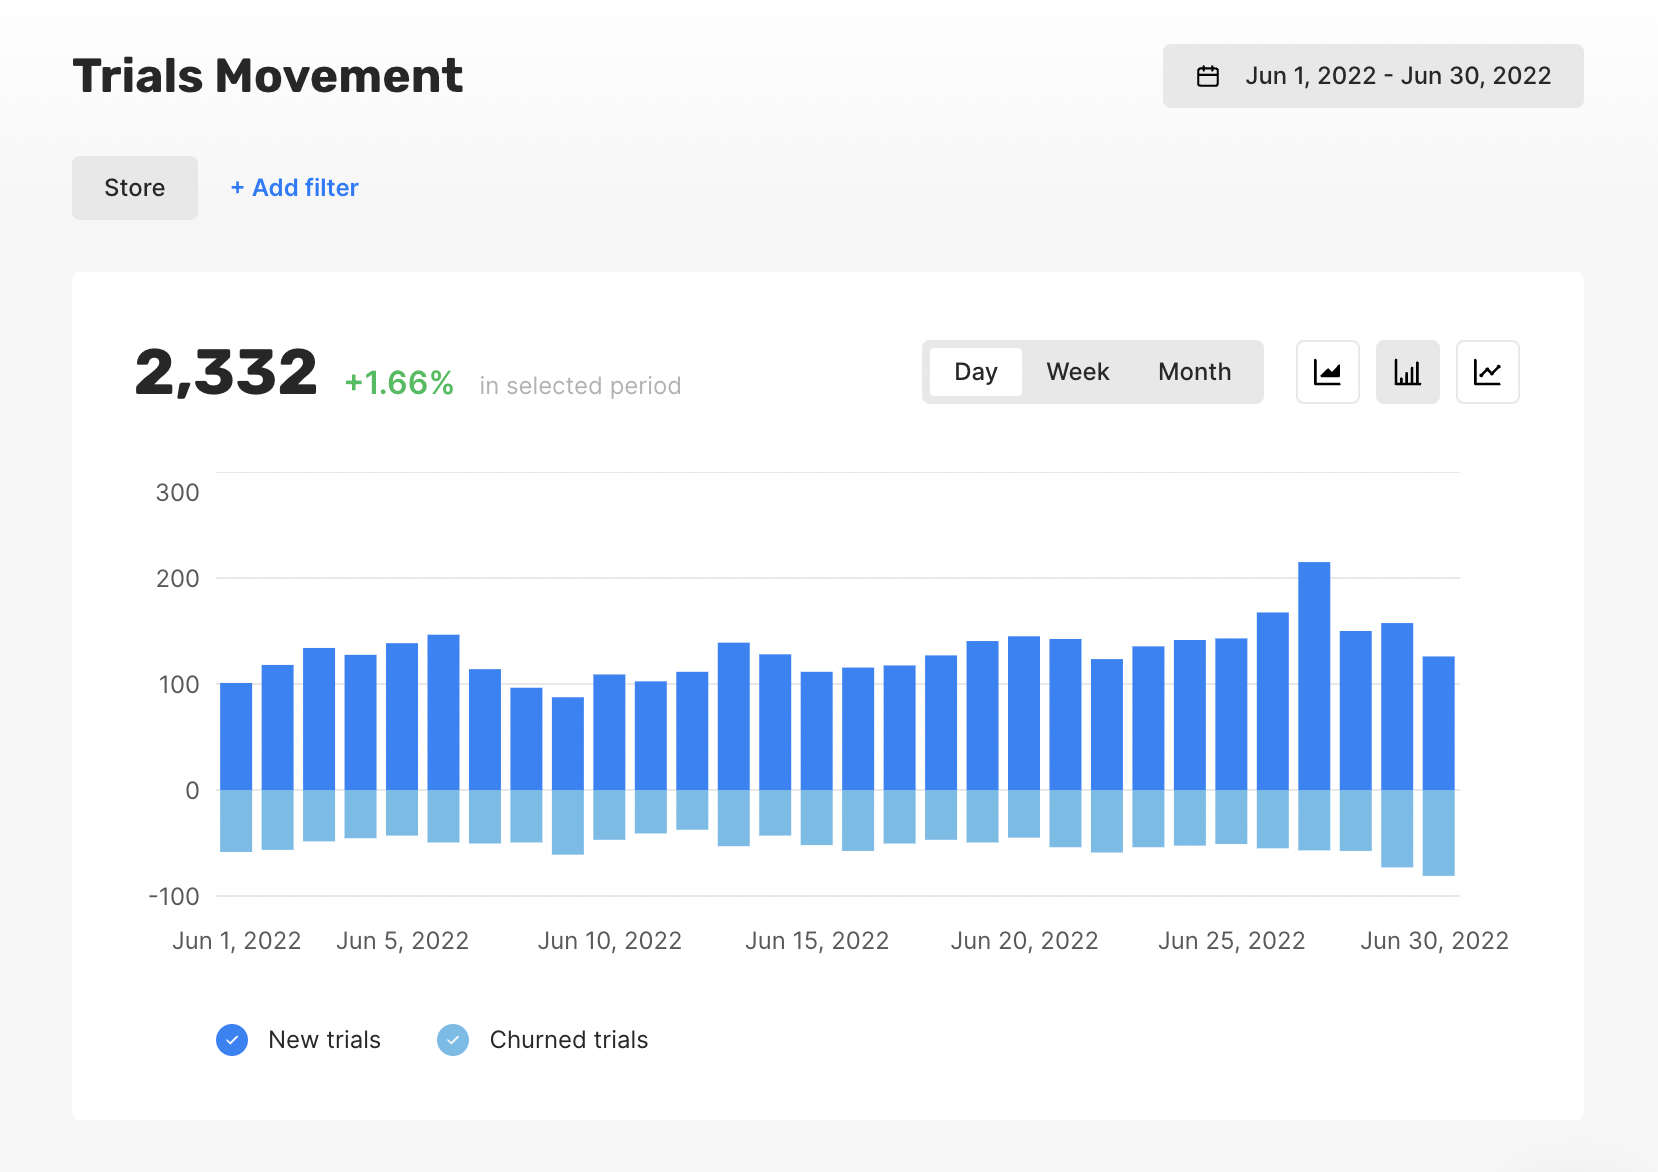
Trials Movement - Mobile Analytics - Qonversion
Trial-to-Paid Conversion
Trials conversion rate is calculated as the ratio of: → Numerator: Trial converted events attributed to trial start date → Denominator: Trial started events for the period chosen For example, 10 trial start events occurred on January 1st. The duration of the trial is 7 days. 2 trials were converted on January 8th, and the rest of the trials were cancelled. The trial conversion rate for January 1st equals 2/10 = 20%. Please note that the chart will show a 0% conversion rate for the most recent 3-7 days as trials for the most recent days have not converted yet. As soon as the conversion happens, the chart is updated with the conversion value.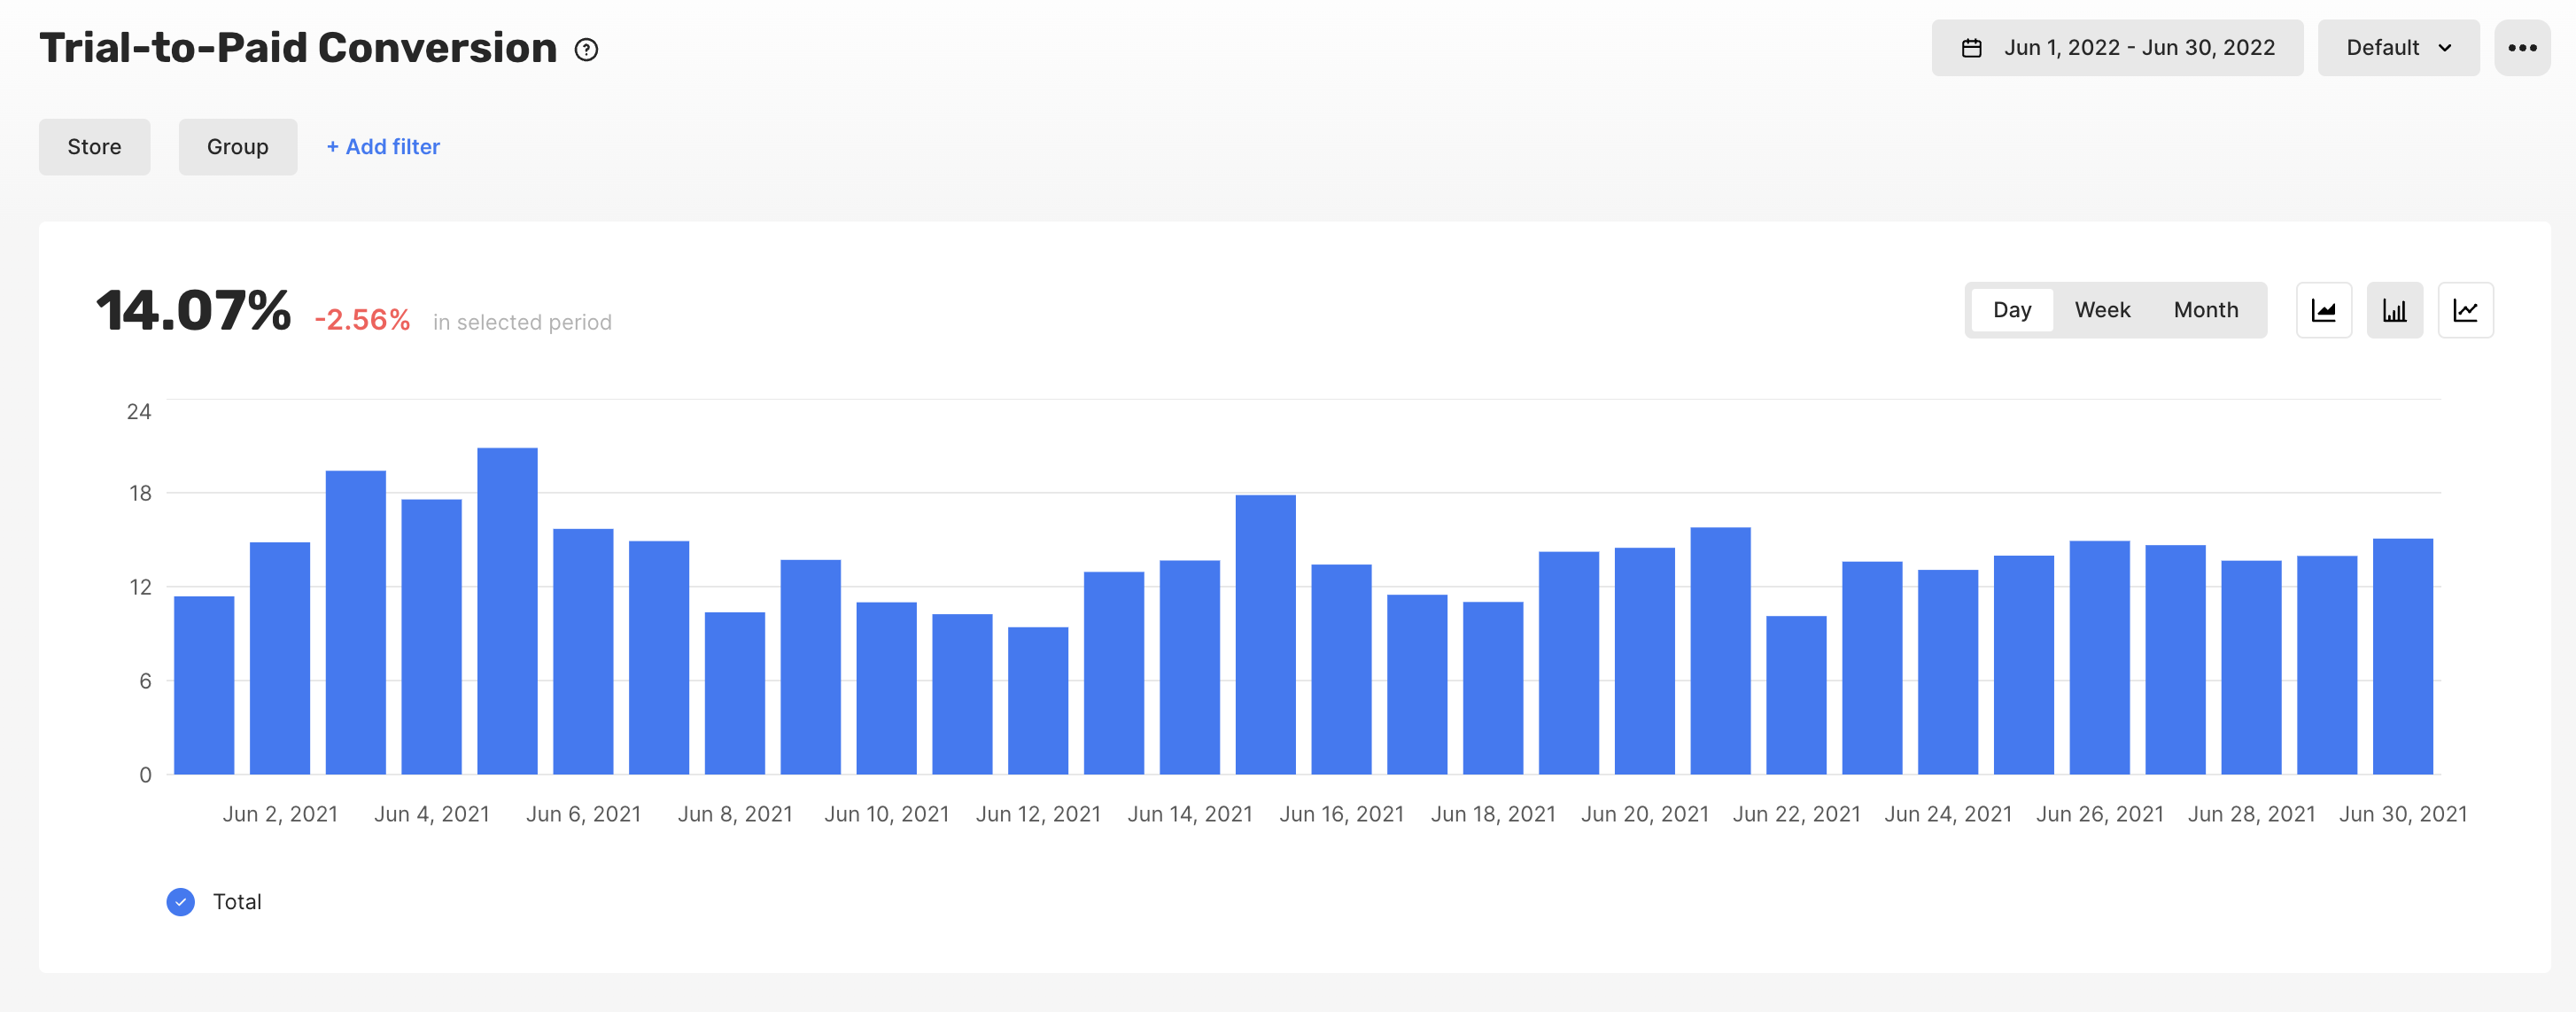
Trials conversion to paying customers - Mobile Analytics - Qonversion
Trials Cancellation Rate
Trials cancellation rate is calculated as the ratio of: → Numerator: Trial cancelled events attributed to trial start date → Denominator: Trial started events for the selected period
Trials cancellation rate - Mobile Analytics - Qonversion
New users Subscriptions