Available Charts
Sales
Available data: revenue after refunds, refunds. All metrics are before deducting the App Stores’ commission.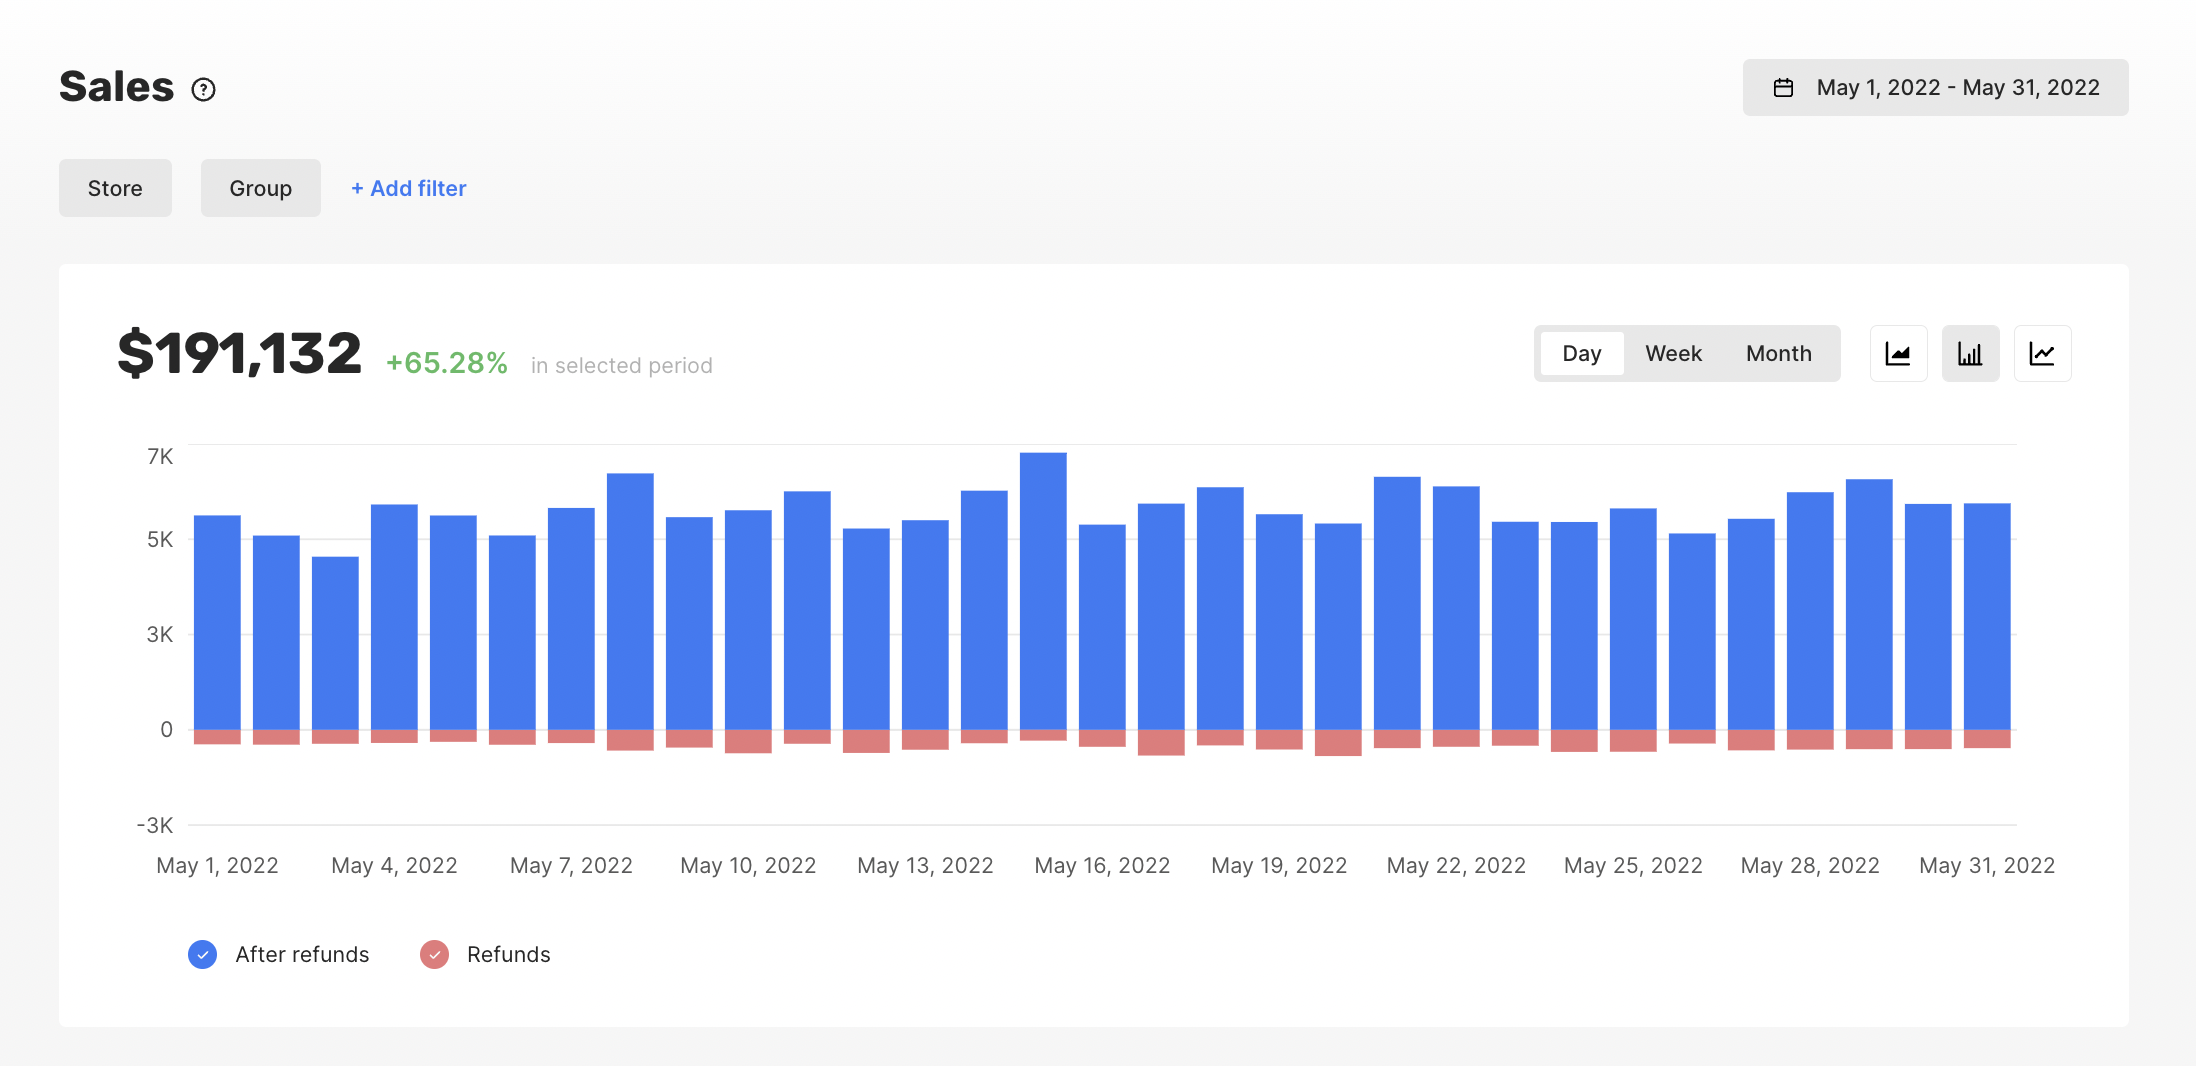
Proceeds
Available data: net revenue (after refunds), refunds. All metrics are after deducting the App Stores’ commission.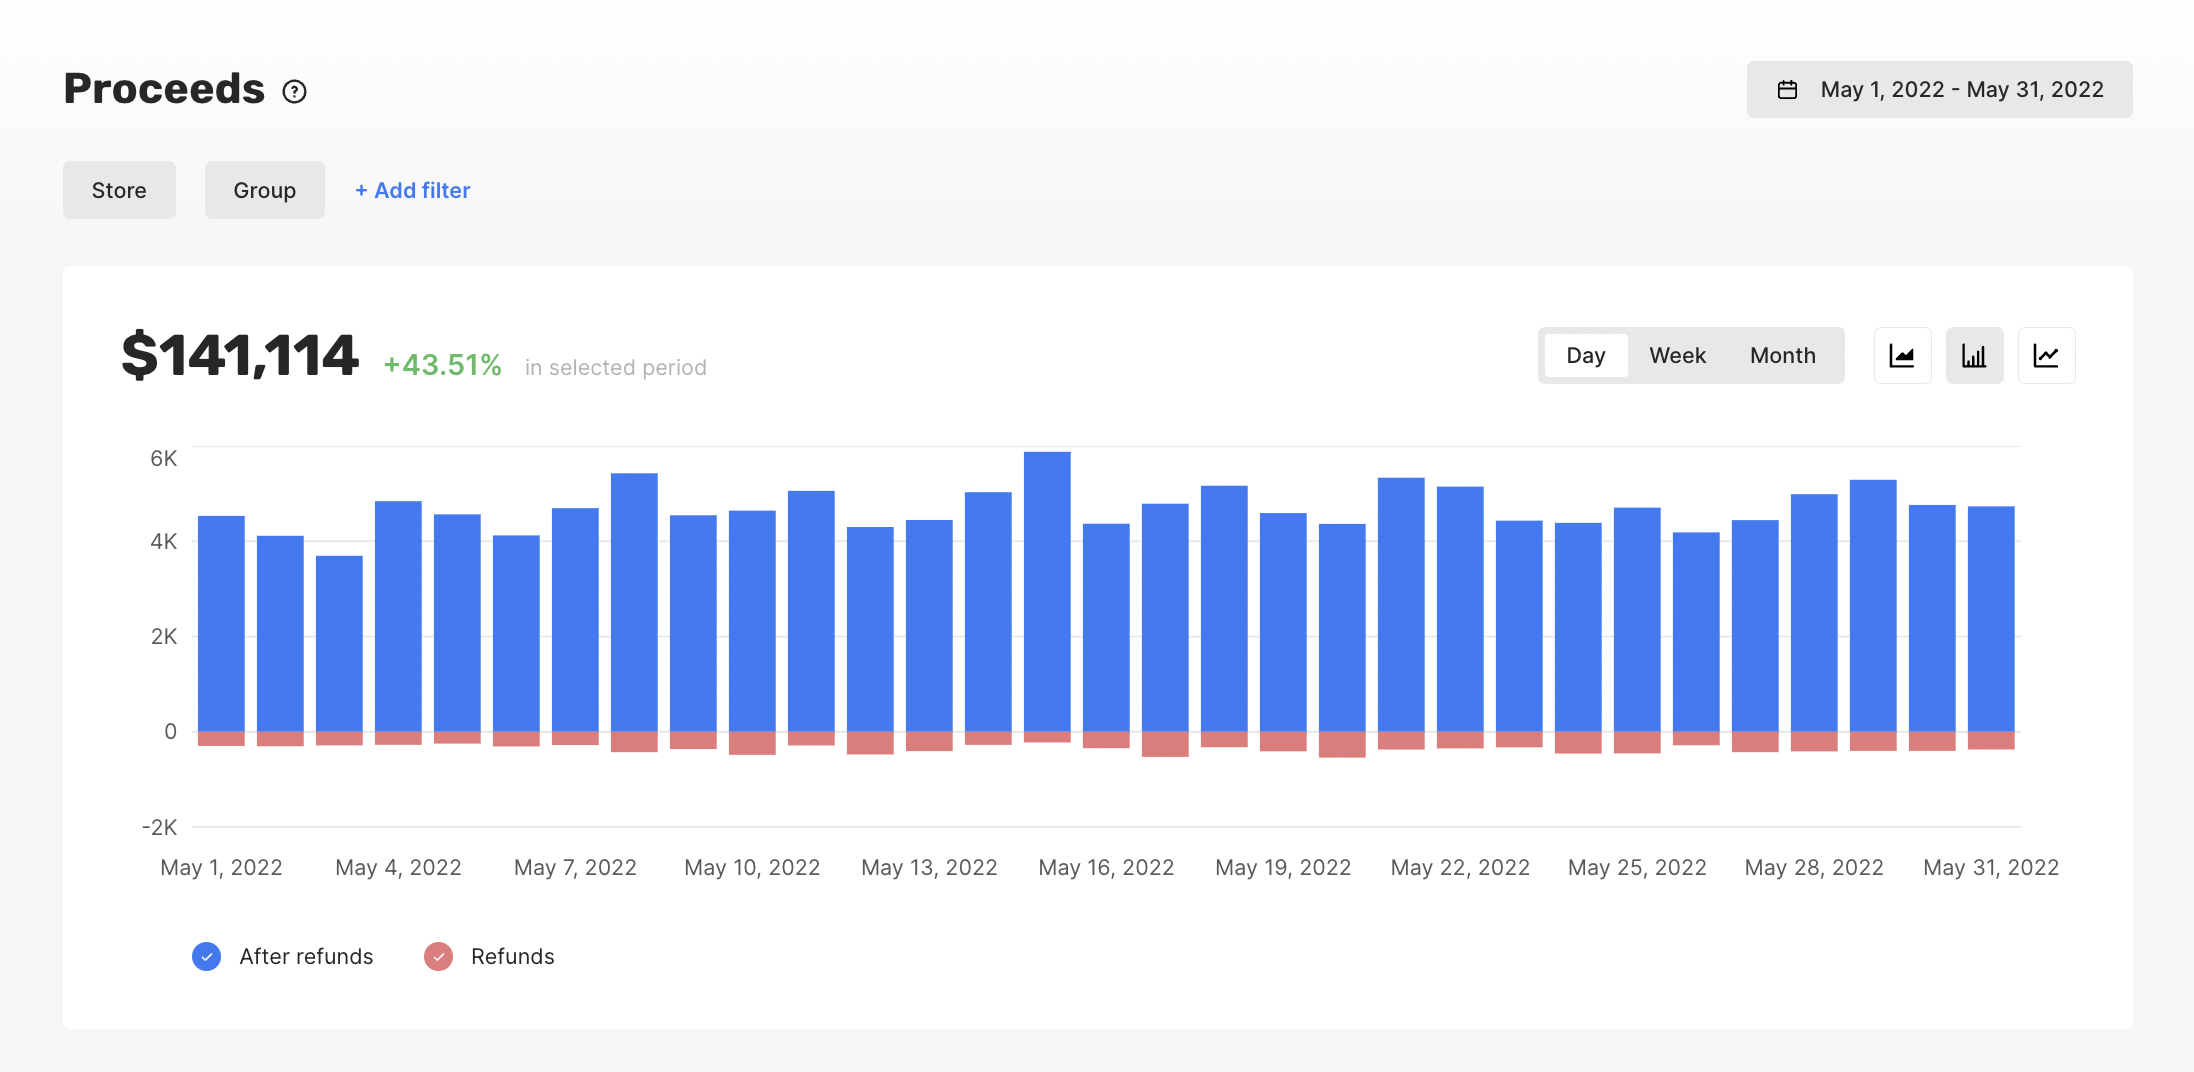
Refunds
Quickly analyse your refunds by product, country, or any other segment.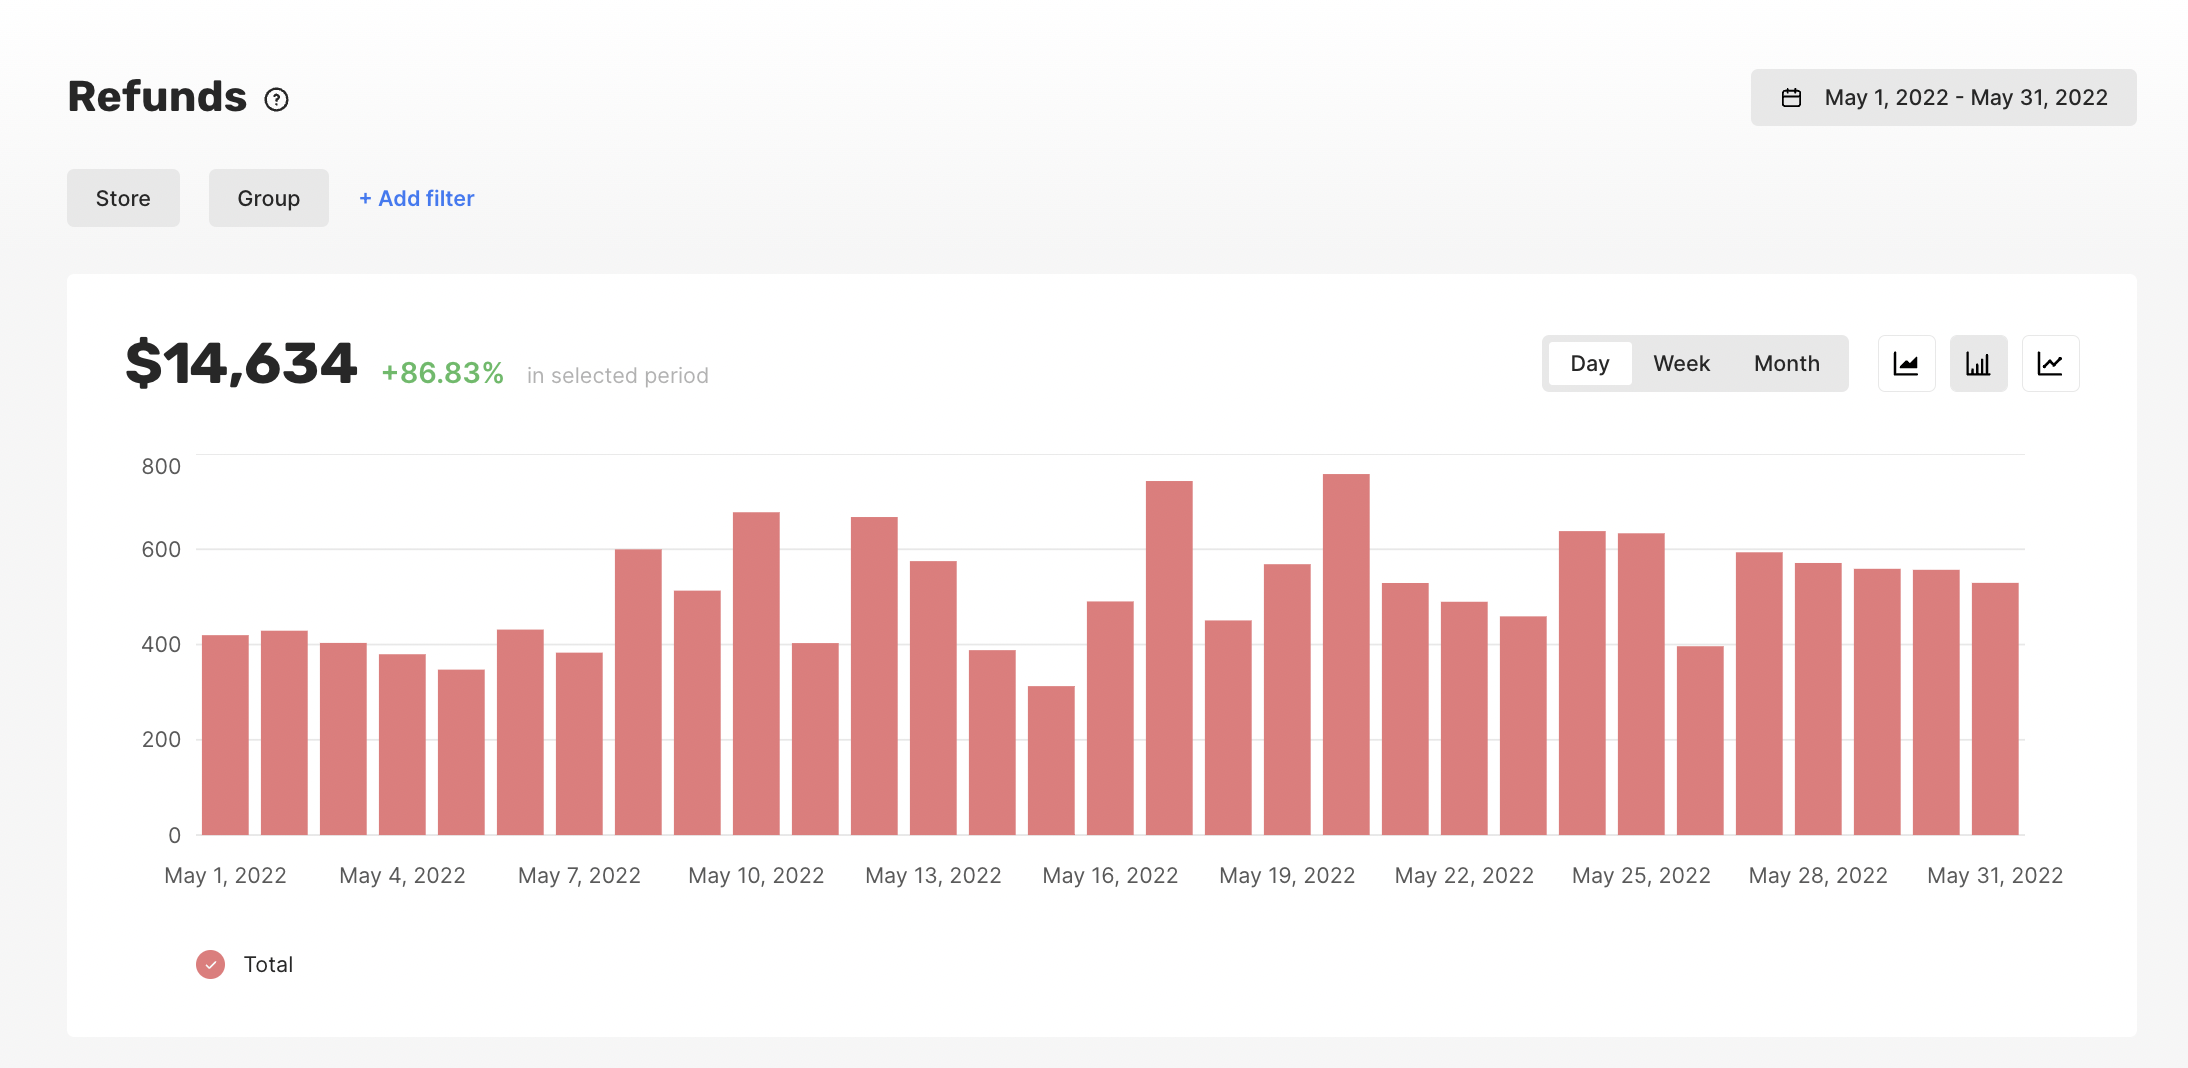
Refund Rate
The Refund Rate chart shows refunded purchases as a share of all purchases for the selected period. Use it to spot quality, billing, or fraud issues by segment. The chart’s title shows the Refund Rate for the selected period; the percentage shows how this value changed compared to the previous period of the same length. Filter or group by product, country, currency, or any other supported attribute to find where refunds concentrate. Available athttps://dash.qonversion.io/analytics/revenue/refund-rate.
ARPU
The Average Revenue Per User (ARPU) chart shows total revenue divided by the number of users for the selected period. ARPU is a top-line monetisation metric that captures both conversion and pricing. The chart’s title shows ARPU for the selected period; the percentage shows how this value changed compared to the previous period of the same length. ARPU is reported with two-decimal precision. Available athttps://dash.qonversion.io/analytics/revenue/arpu.
ARPPU
The Average Revenue Per Paying User (ARPPU) chart shows total revenue divided by the number of paying users for the selected period. Unlike ARPU, ARPPU isolates the spend behaviour of users who actually pay and is the better signal for pricing or paywall changes. The chart’s title shows ARPPU for the selected period; the percentage shows how this value changed compared to the previous period of the same length. ARPPU is reported with two-decimal precision. Available athttps://dash.qonversion.io/analytics/revenue/arppu.
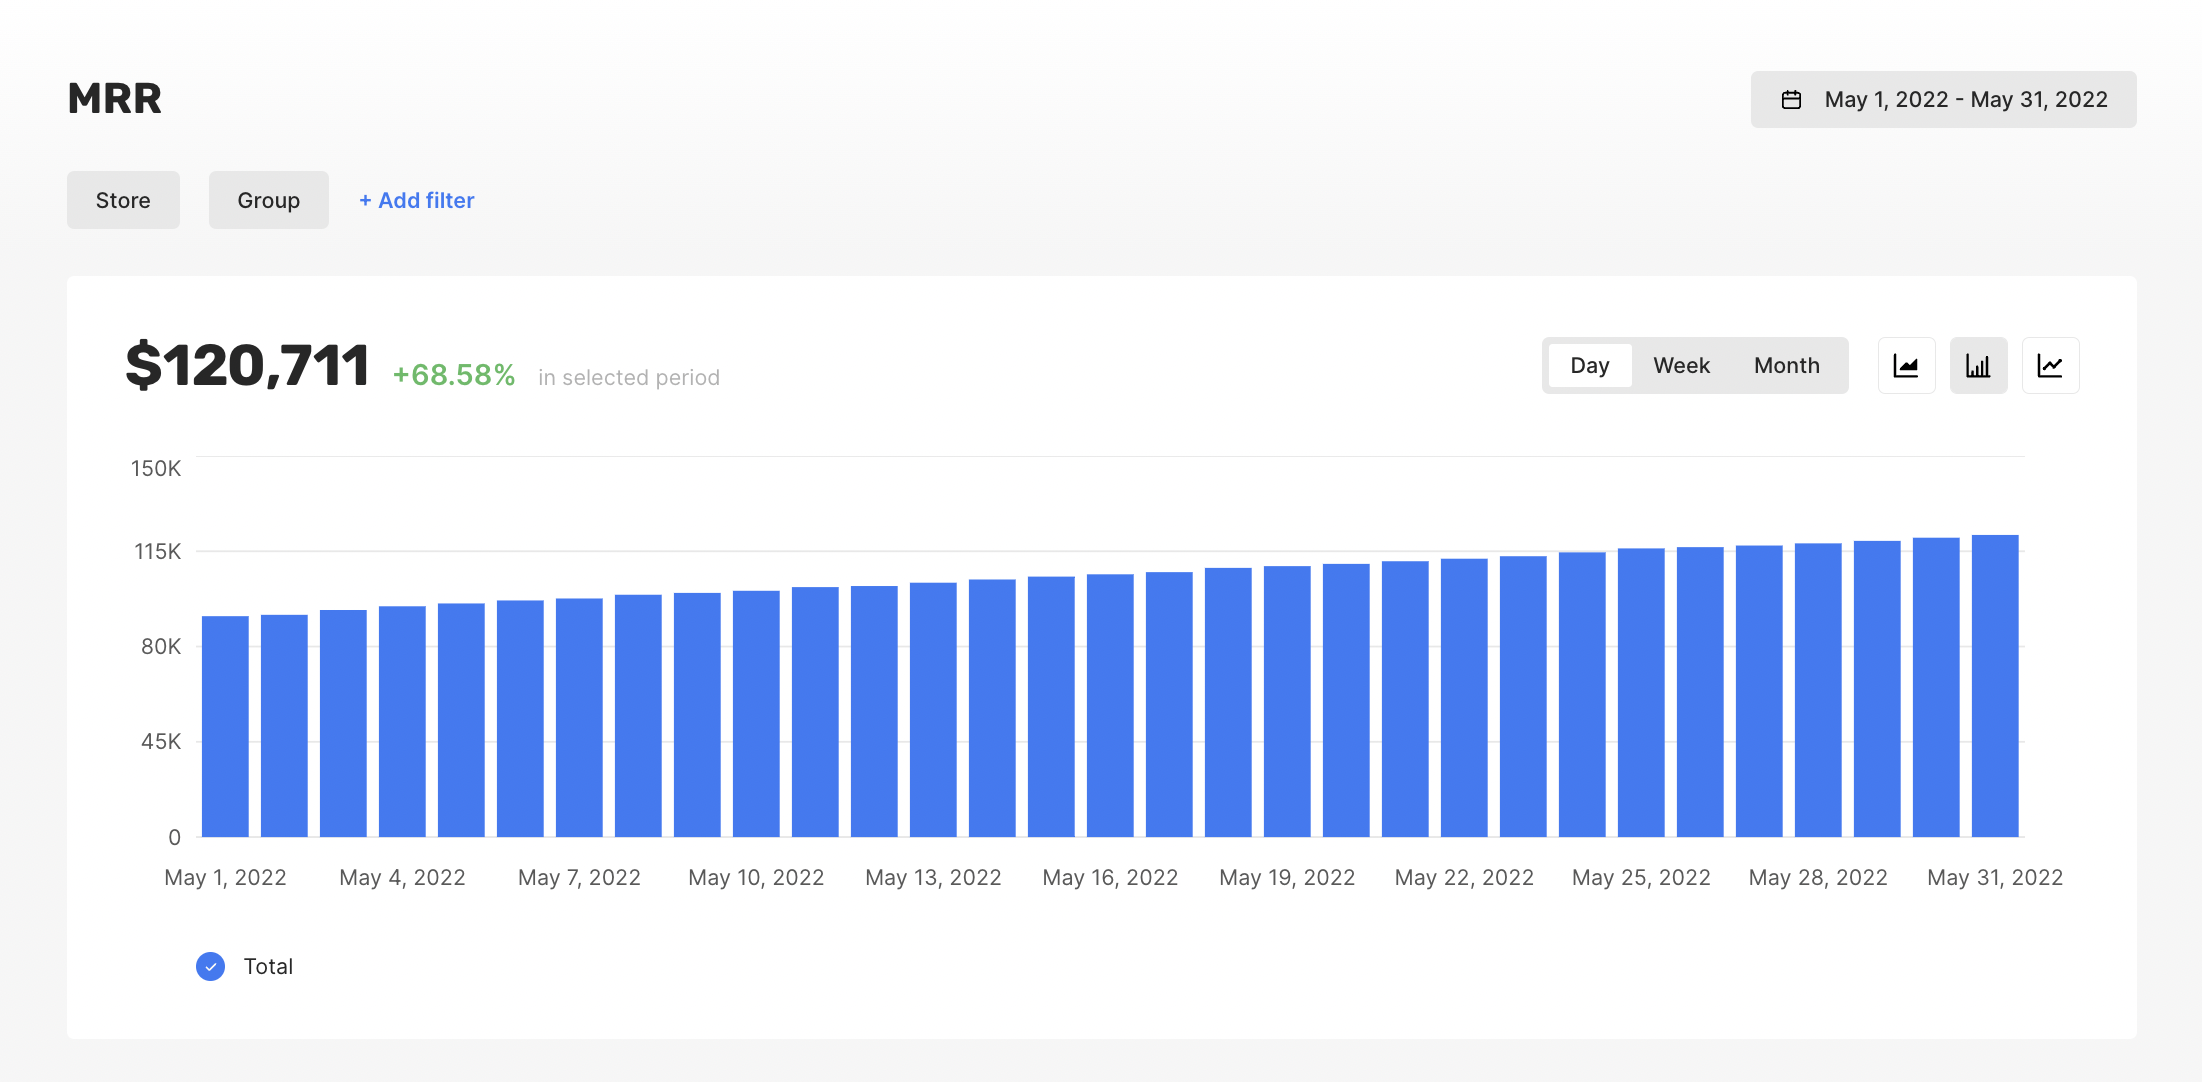
MRR
The Monthly Recurring Revenue (MRR) chart shows the normalized monthly revenue from all active subscriptions for the selected dates. The MRR chart includes only subscriptions with auto-renewal turned on. For normalizing subscriptions’ prices to a month, we use the following multiples depending on a subscription duration:- Weekly subscription multiple: 4.35,
- Monthly subscription multiple: 1.0,
- Two months subscription multiple: 0.5,
- Three months subscription multiple: 0.33,
- Six months subscription multiple: 0.166,
- Annual subscriptions multiple: 0.083.
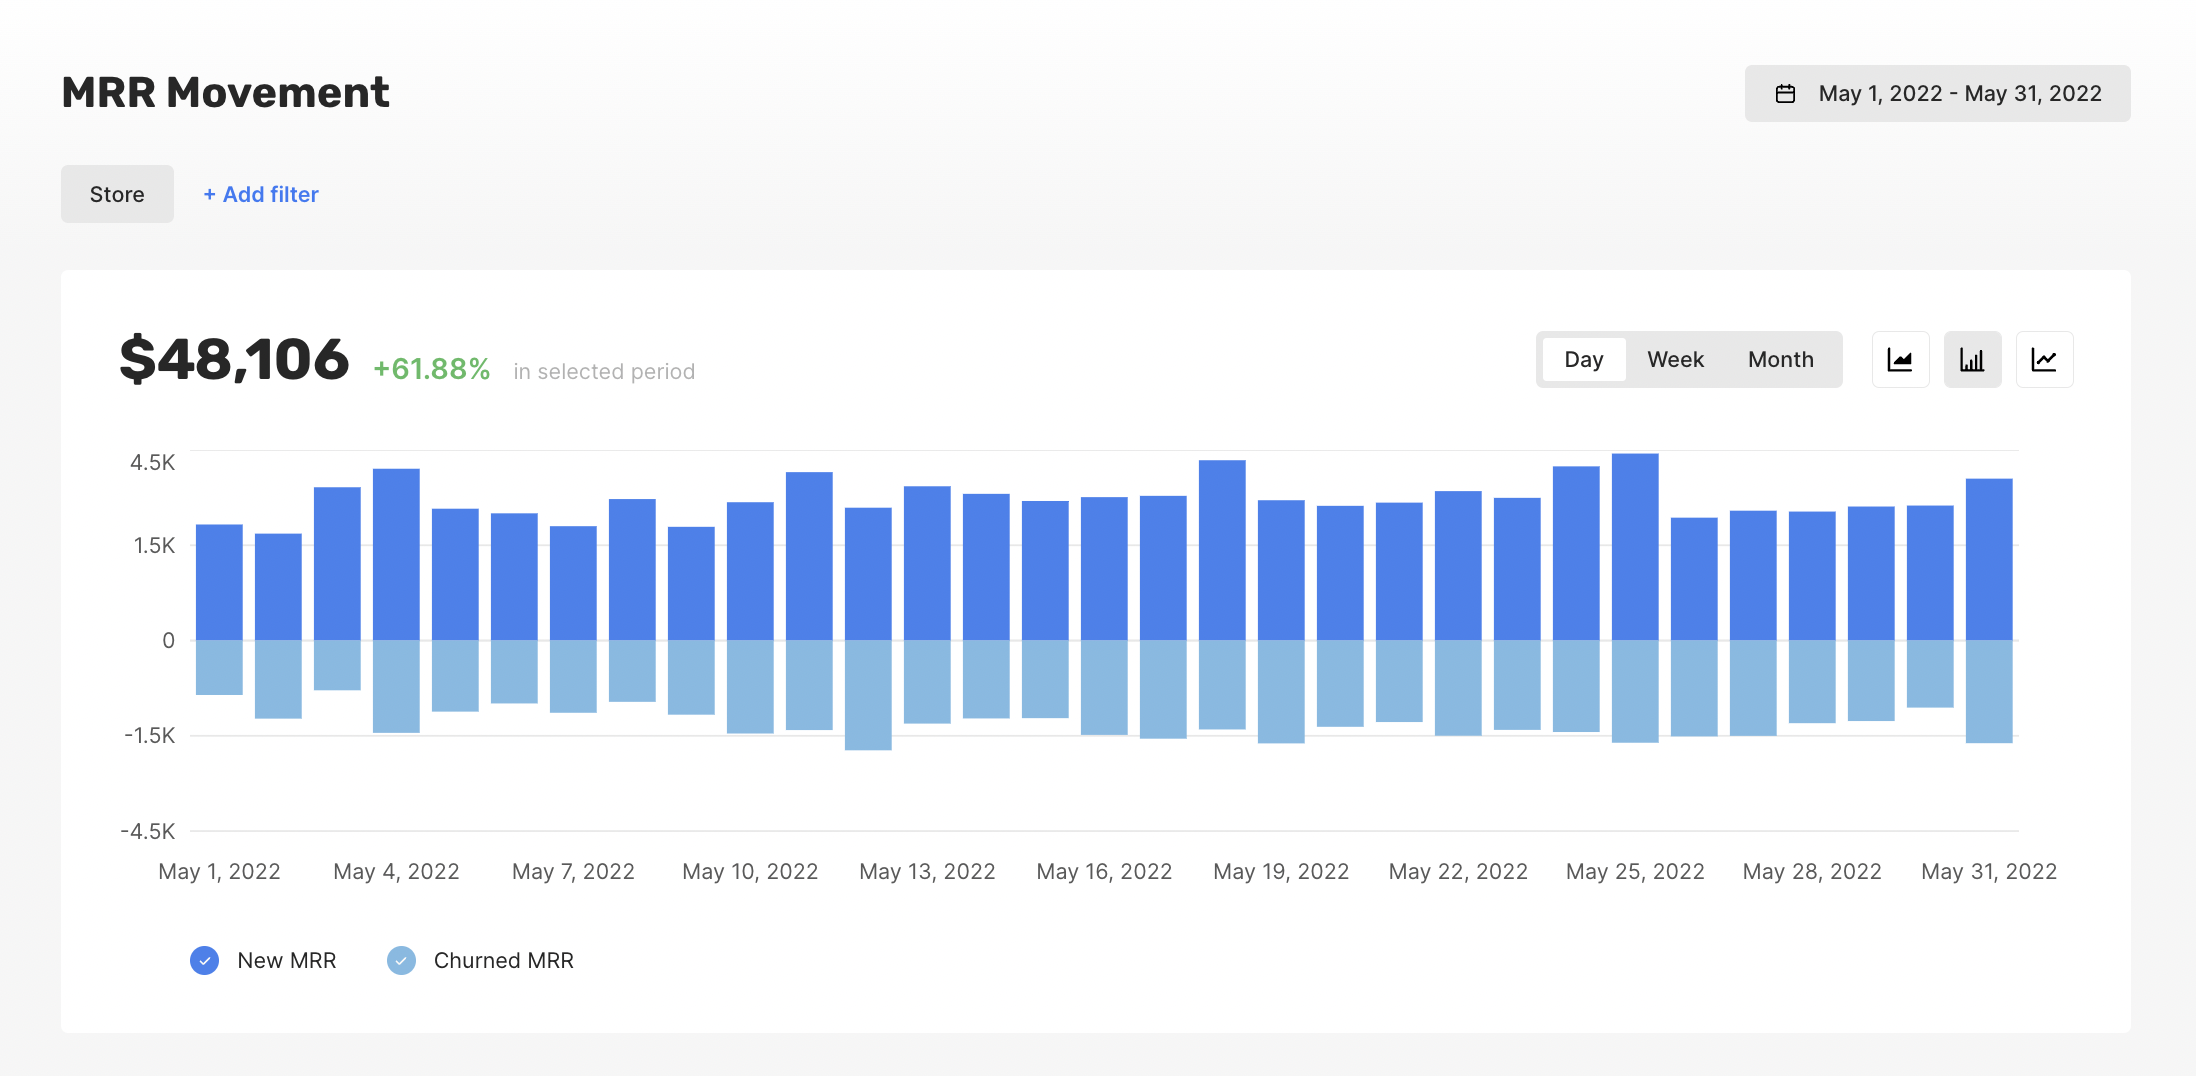
MRR Movement
MRR Movement helps you understand how subscriber base changes affect your monthly recurring revenue over time. This chart shows the revenue change caused by new paid subscriptions (above zero), and churned or cancelled subscriptions (below zero), i.e., expired, refunded or cancelled subscriptions. The chart’s title shows the net recurring revenue during the selected period; the percentage shows how this value changed compared to the previous period of the same length. In the example below, the MRR increased by $48,106, which is 61.88% higher than the growth in the previous period of the same length (31 days).Billing Grace Period and MRR/ARR
When a subscription enters billing retry, app stores may grant a billing grace period during which the subscriber retains access while the store attempts to recover payment. Qonversion uses the store-configured grace period duration to determine how subscriptions in billing retry are reflected in MRR, ARR, MRR Movement, and ARR Movement charts:- Grace period configured: the subscription continues to count toward MRR/ARR during the grace period. It is counted as churned in MRR/ARR Movement only after the grace period expires, not at the moment billing retry begins.
- No grace period: the subscription stops contributing to MRR/ARR at the end of the last paid period.
ARR
The Annual Recurring Revenue (ARR) chart shows the normalized annual revenue from all active subscriptions for the selected dates. It works the same way as MRR above, except that the revenue is normalized by 12 months.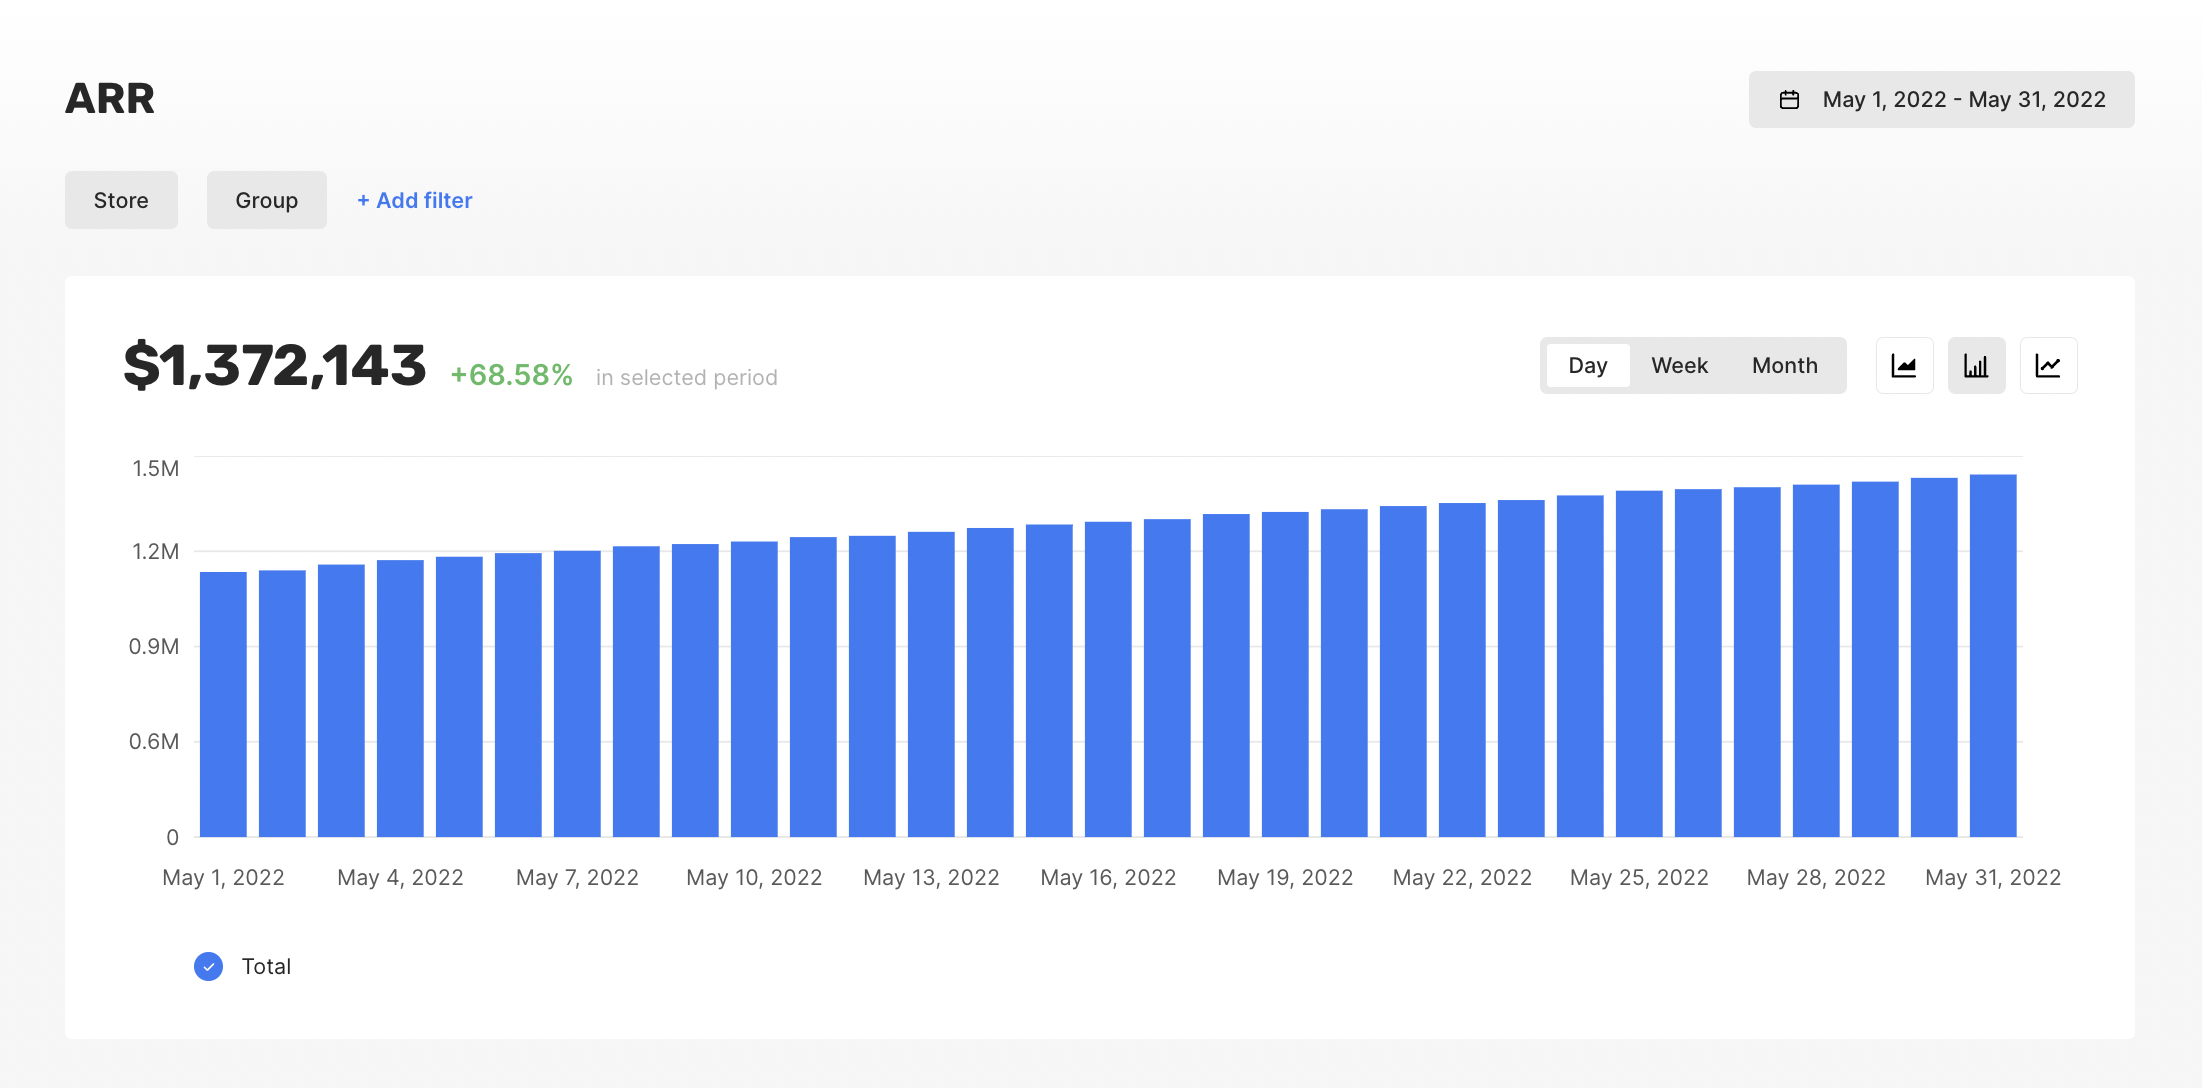
ARR Movement
The Annual Recurring Revenue Movement chart works the same way as MRR Movement, except that the revenue is normalized by 12 months.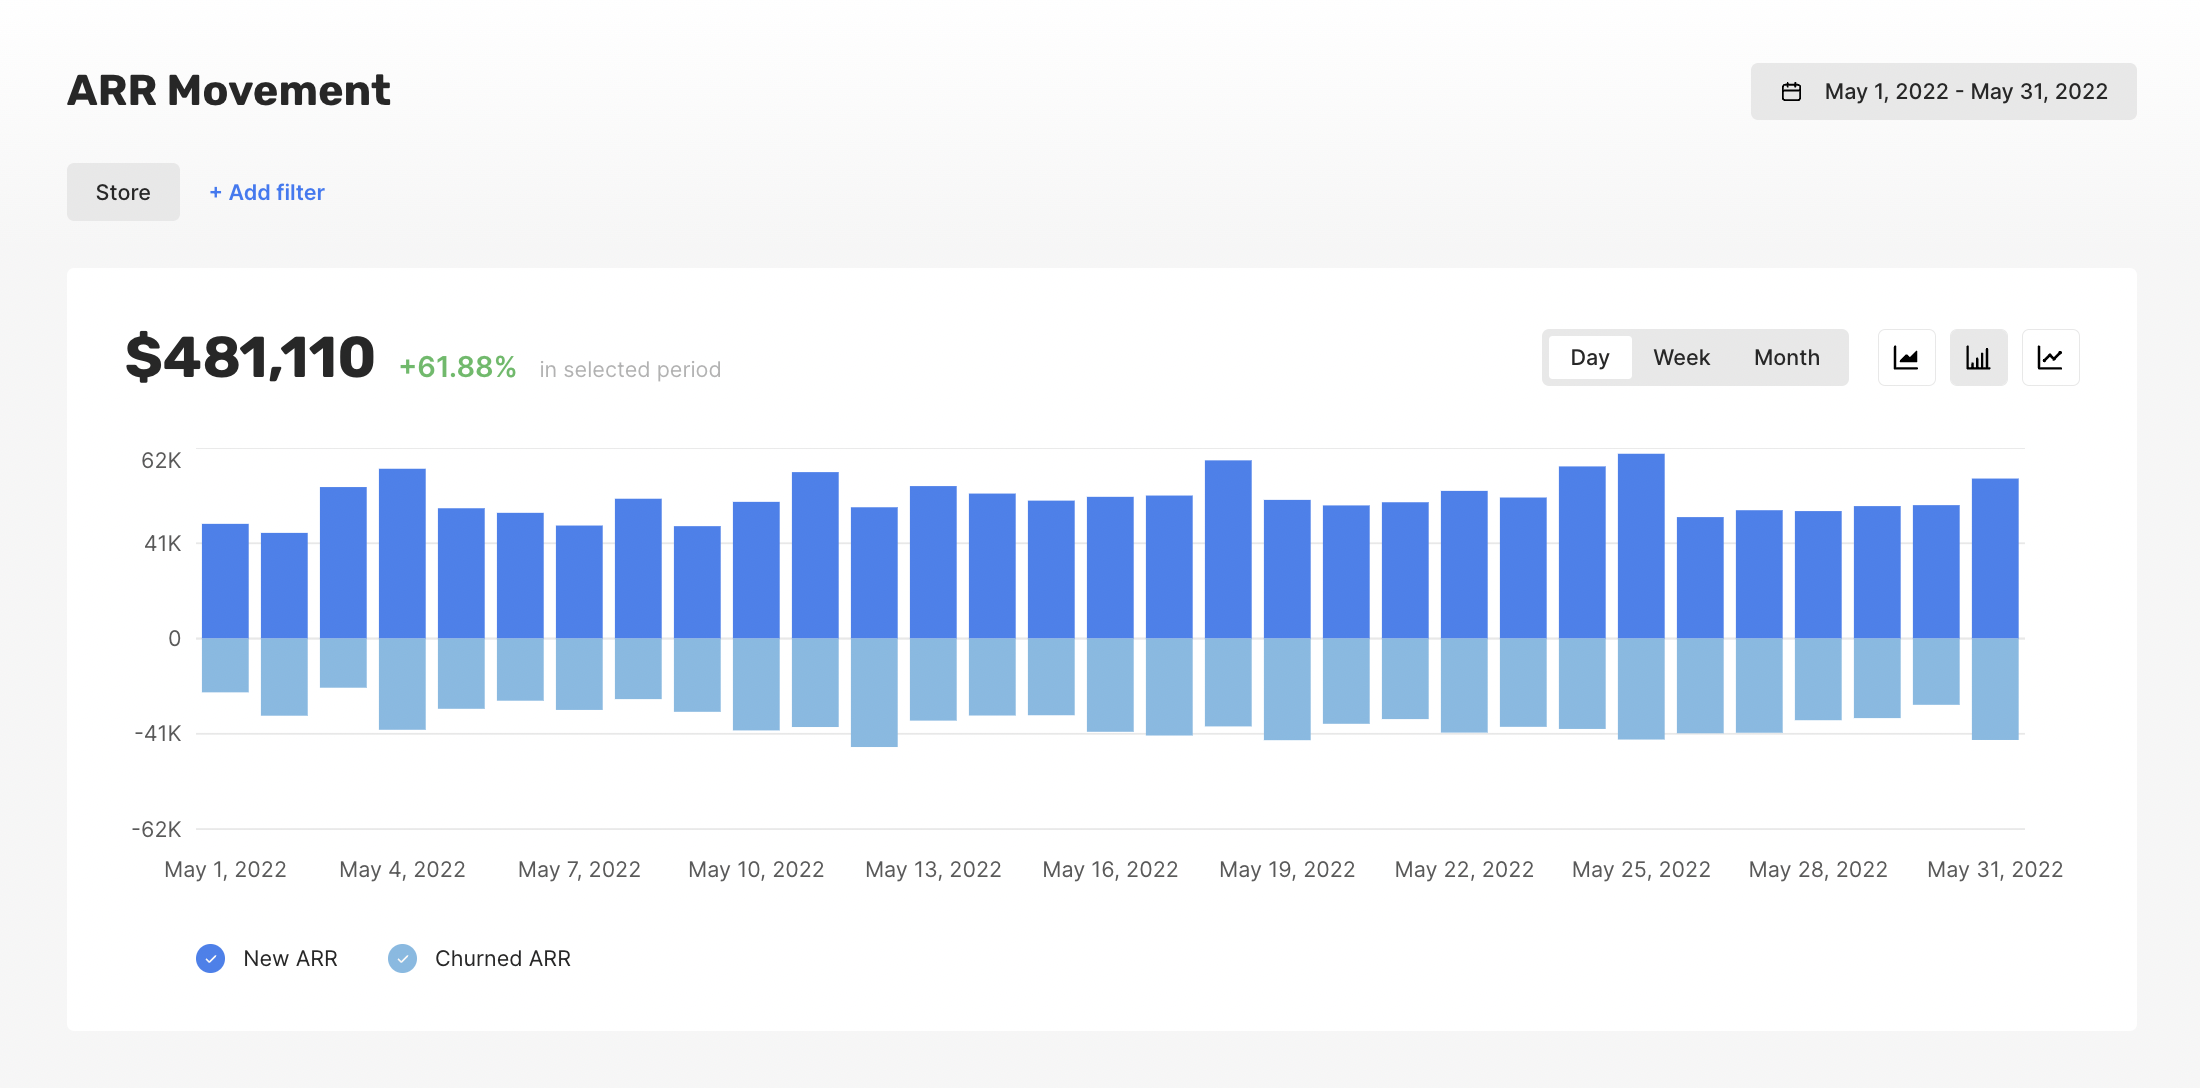
Monitoring New users