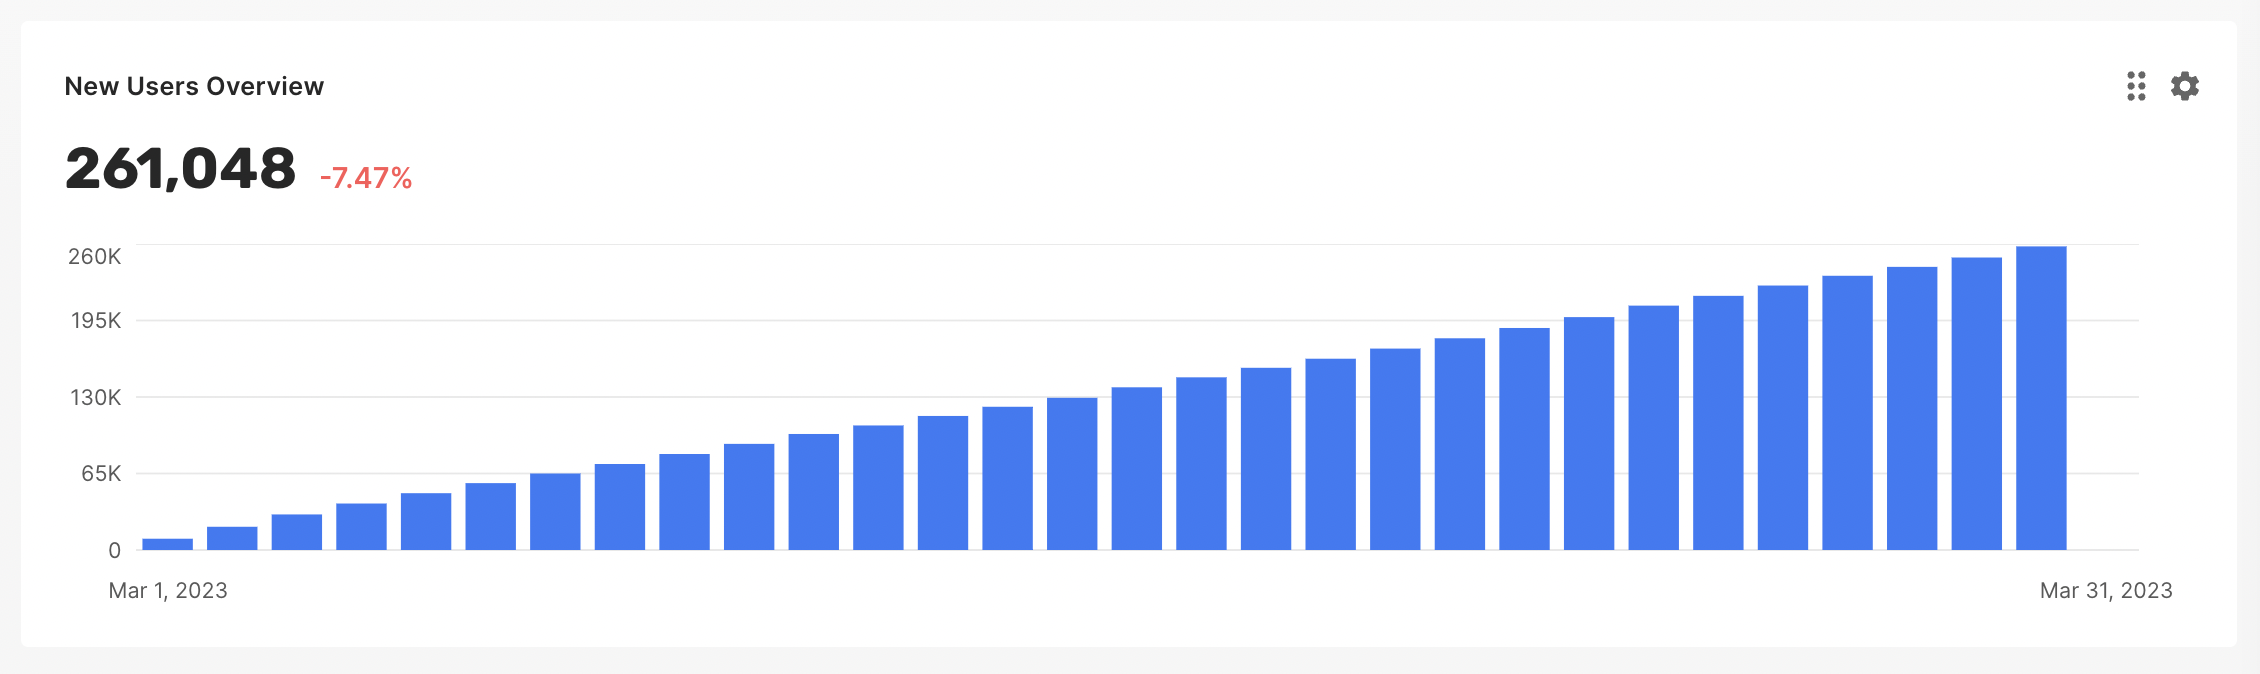
Available metrics
You can add a widget with any metric that is present in the Qonversion Dashboard:- New Users Overview
- New-User-to-Trial Conversion
- New-User-to-Paid Conversion
- Active Trials
- New Trials
- Trials Movement
- Trial-to-Paid Conversion
- Trials Cancellation Rate
- Active Subscriptions
- New Subscriptions
- Subscriptions Movement
- Subscriptions Cancellation Rate
- Sales
- Proceeds
- Refunds
- Refund Rate
- MRR
- MRR Movement
- ARR
- ARR Movement
- Events
How to set up
Qonversion Monitoring dashboard can be flexibly customized. We’ll provide a step-by-step guide for:- Adding widgets
- Configuring them to display the metrics that matter most to you
- Arranging the widgets in the order that makes the most sense for your needs.
Adding widgets
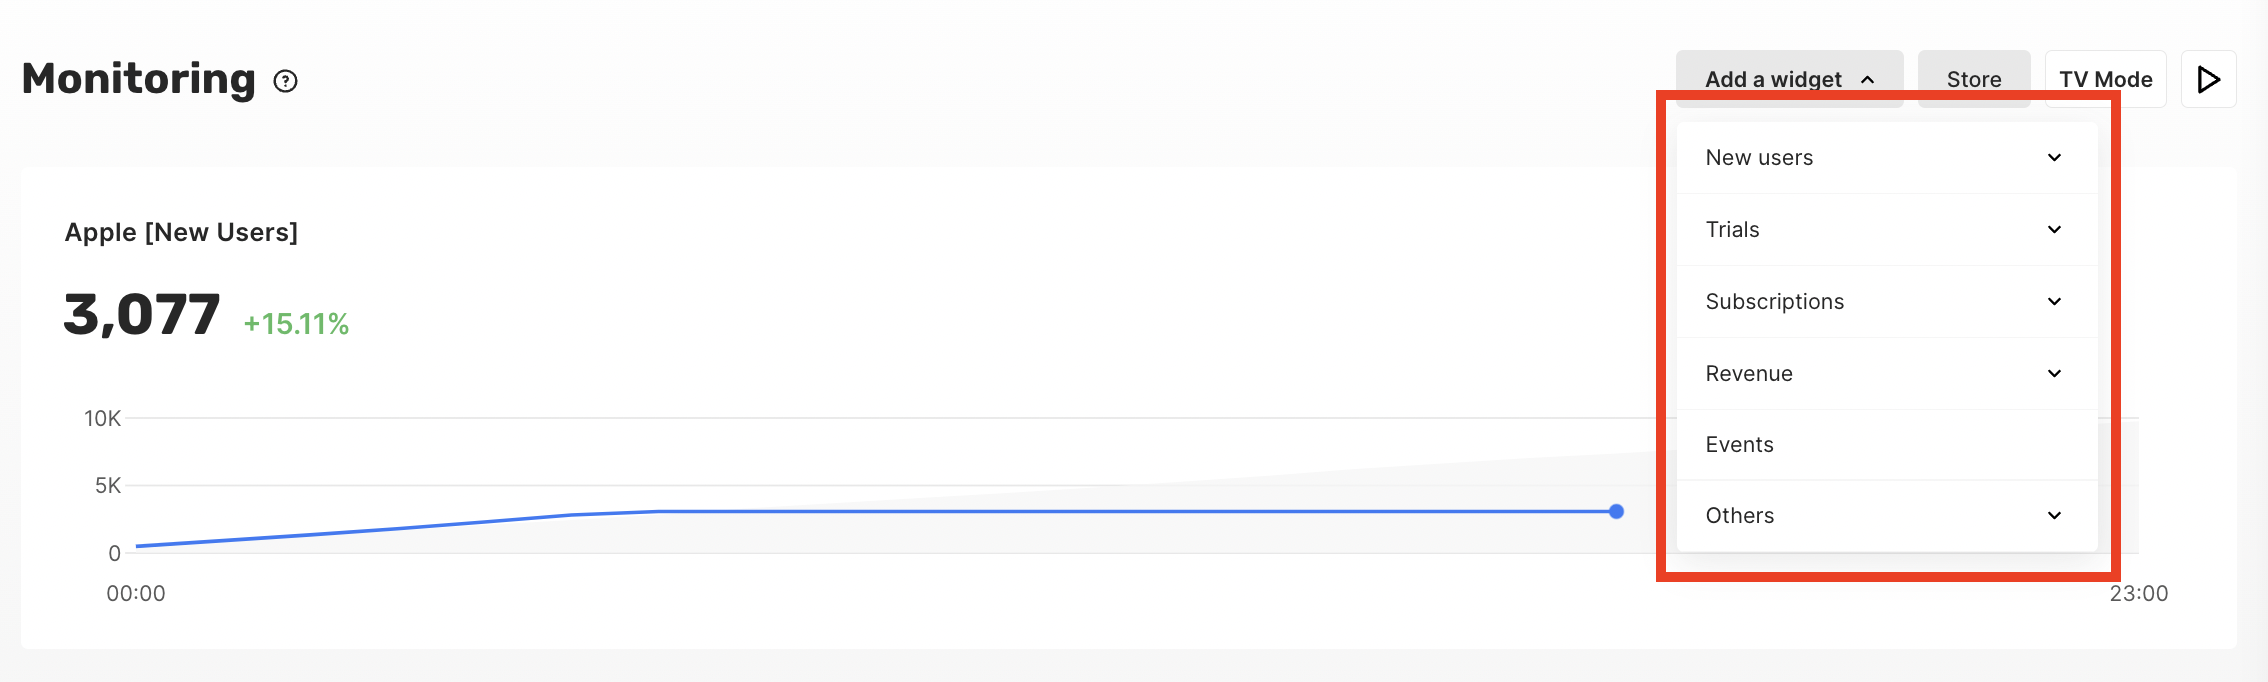
To add a new widget to your dashboard- Click the Add a widget button
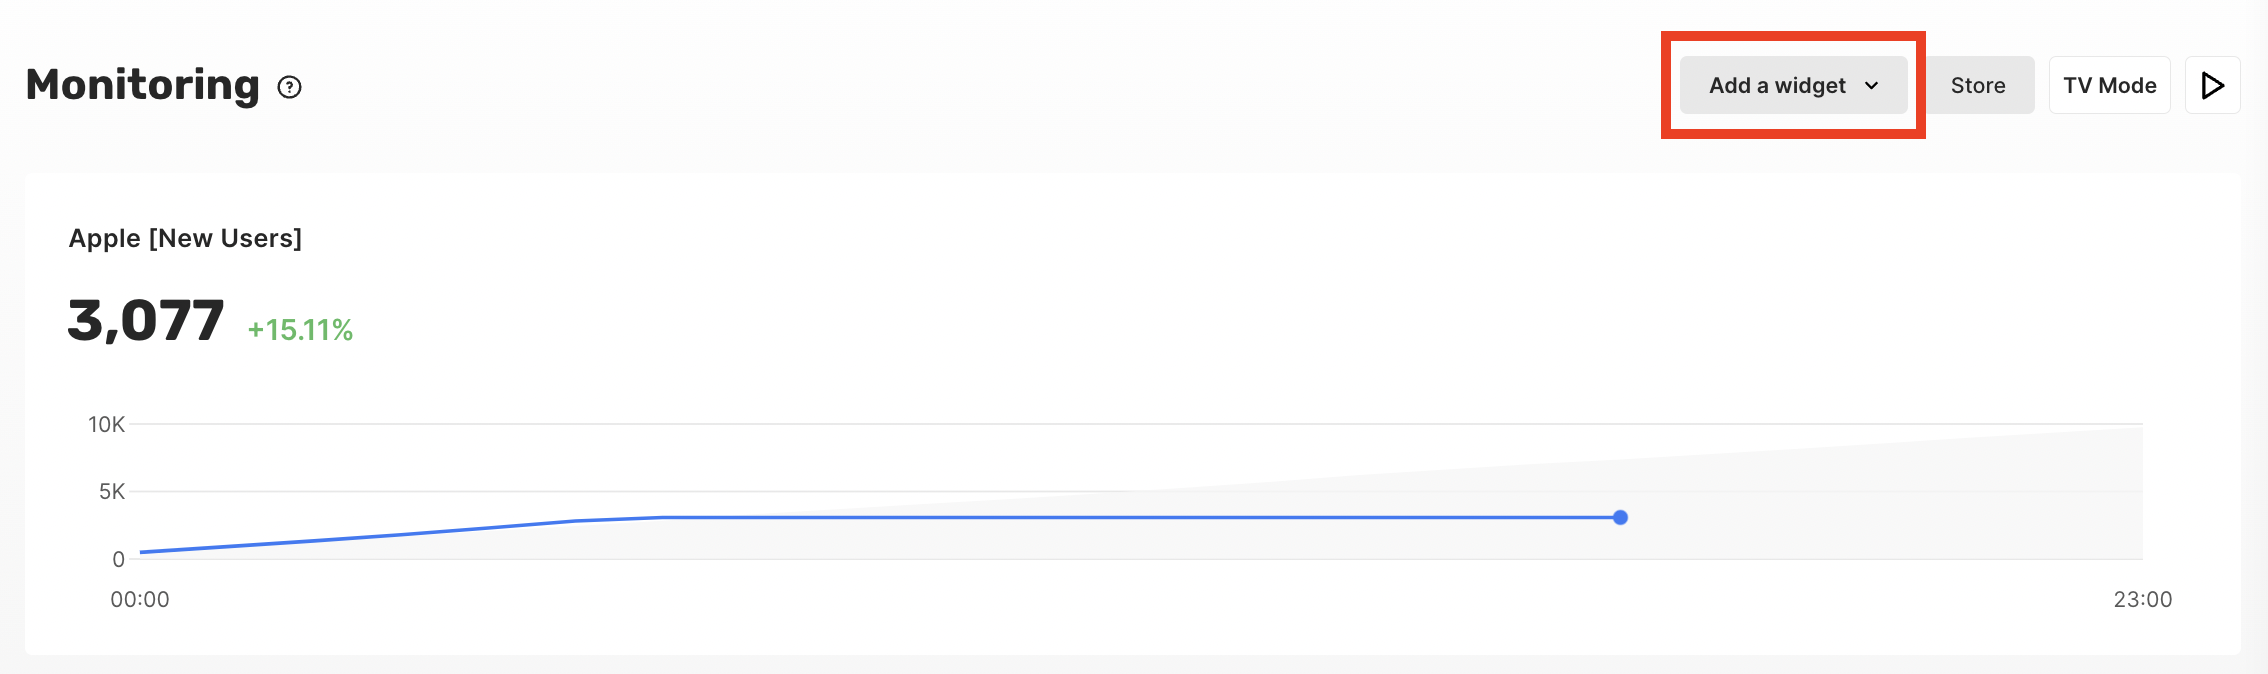
- Choose one of the 21 available metrics from the drop-down menu.
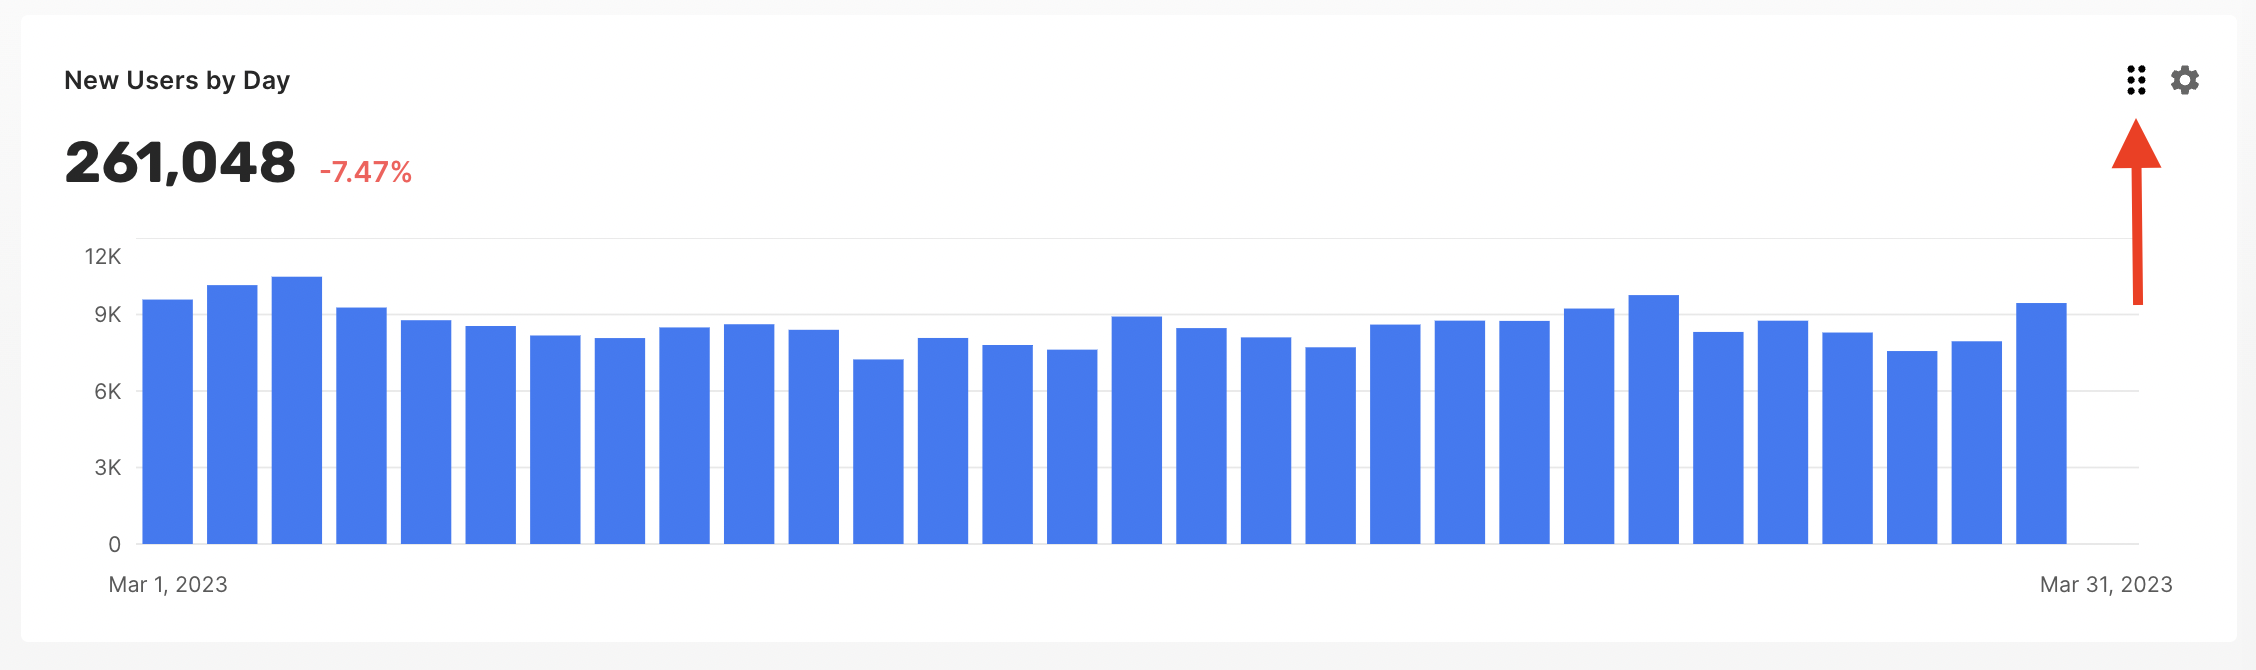
Configuring widgets
To configure a widget according to your needs:-
Hover the widget’s top right corner and click the settings button

-
Adjust any of the following attributes:
- Metric to Display (one of the 21 available metrics)
- Data format (cumulative or incremental)
- Grouping option
- Store filter
- Period to display (from Current Day to Last Year)
- Widget’s Title
- Chart Type
- Chart Width
-
Click the Save button

Arranging widgets
To arrange widgets in the order that makes the most sense for your needs:- Hover the widget’s top right corner and press the drag-n-drop button
- Place the widget in the desired place on the dashboard
- Release the drag-n-drop button
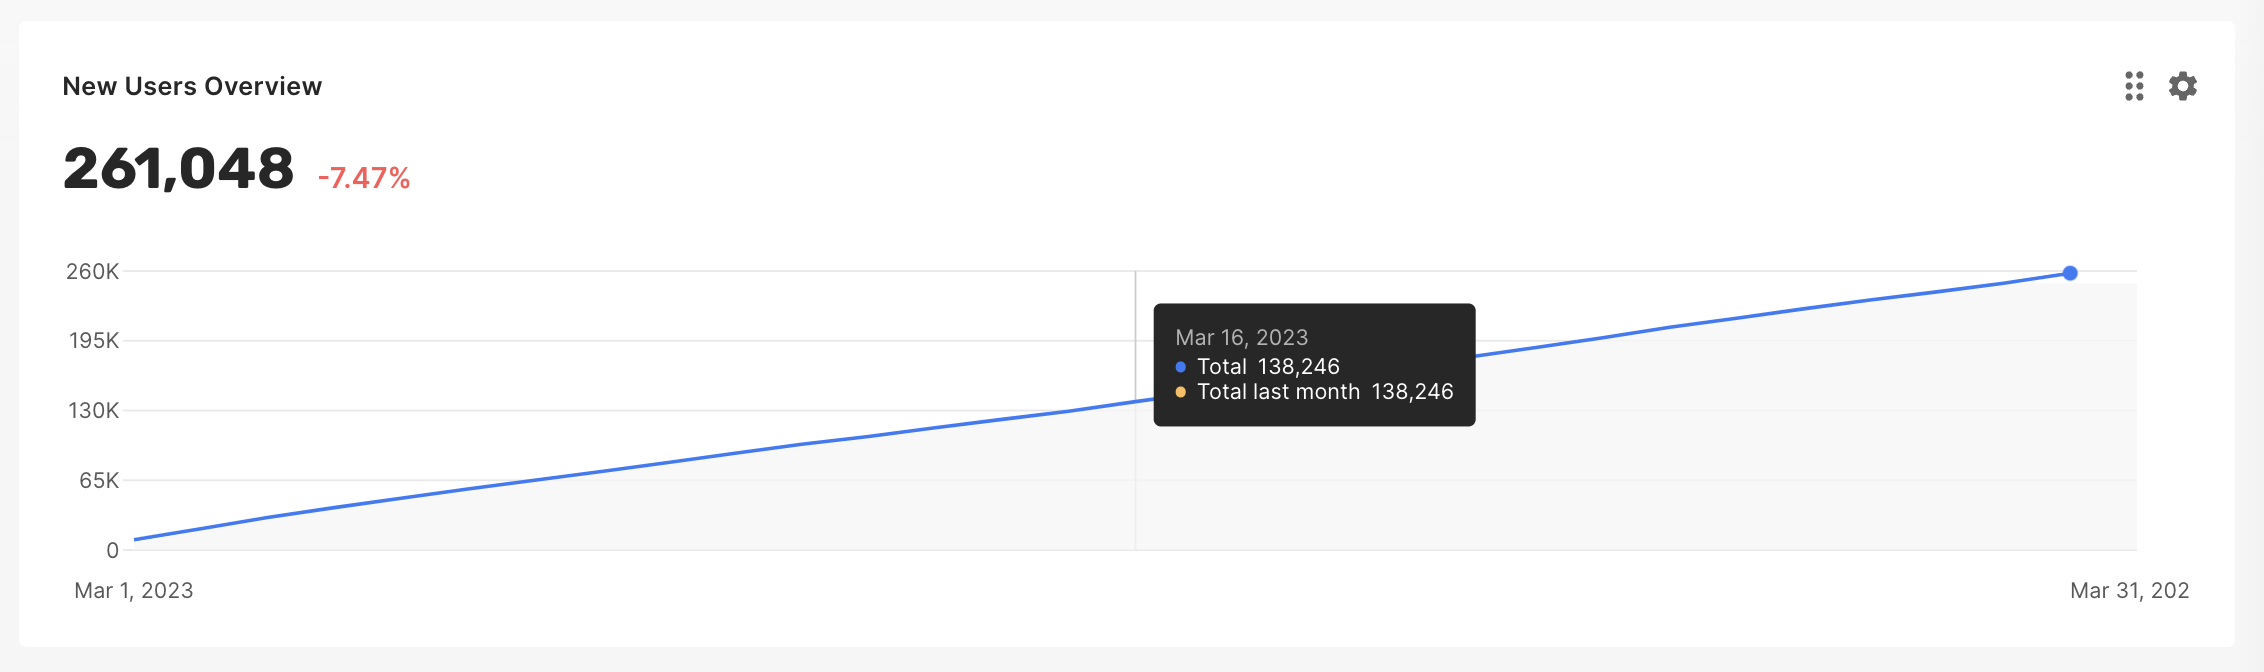
Cumulative Data Format
In the widget’s settings, you can find an option to choose cumulative data format.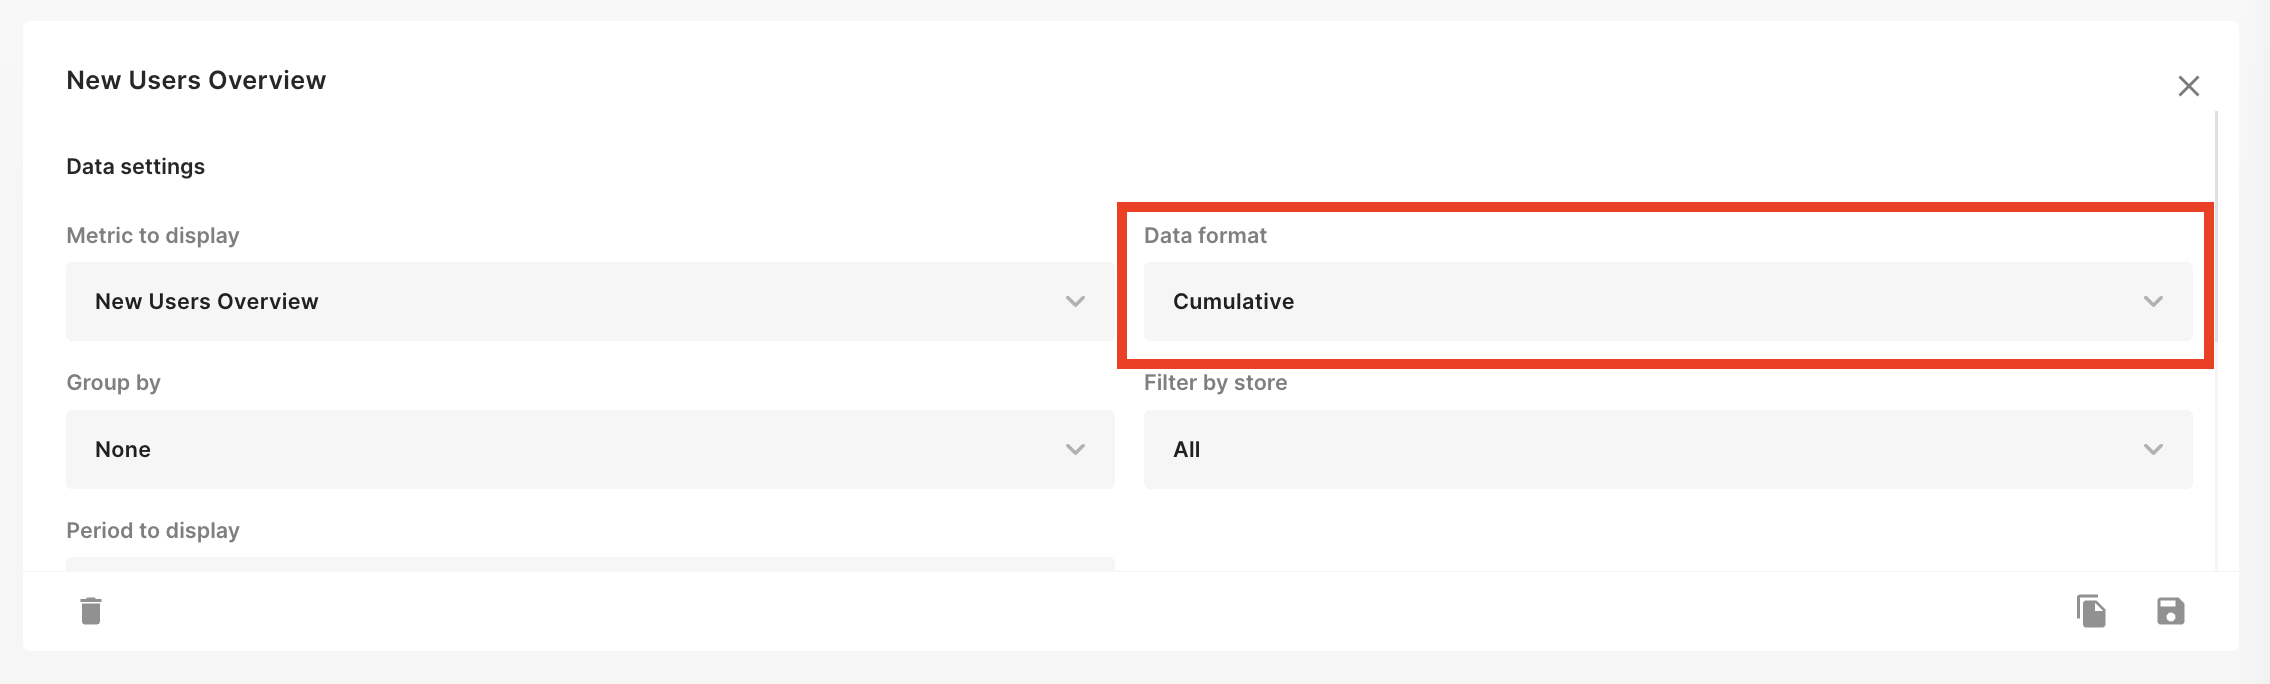
Percentages explained
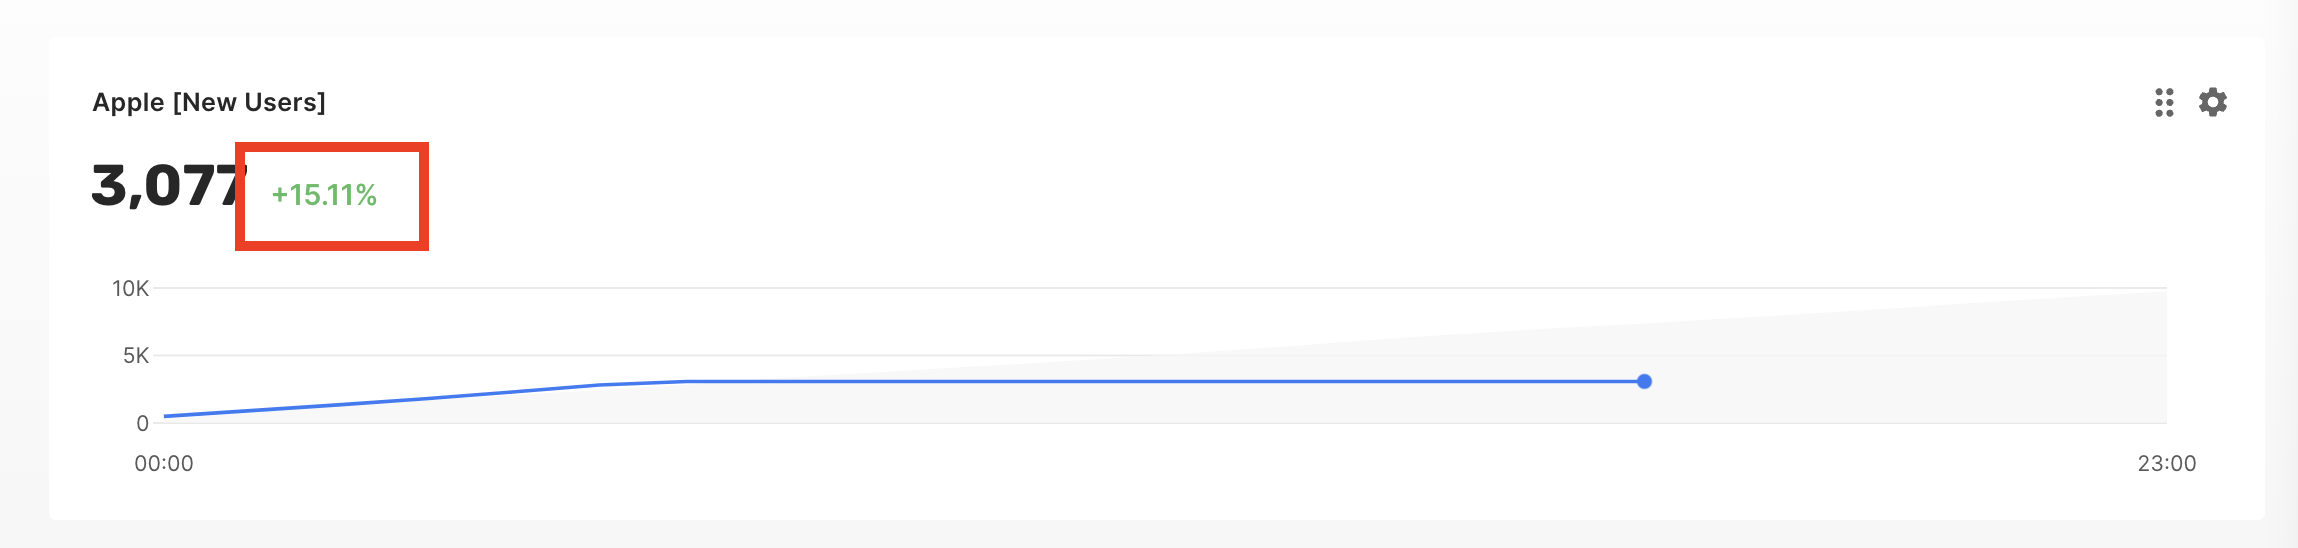
- We take the chart’s value (a number which is located to the left of the percentage)
-
Compare the value with the one calculated accordingly to the widget’s period to display setting:
- Current day -> The same day the previous week until the current time
- Current week -> Previous week until the current time
- Current month -> Previous month until the current time
- Current year -> Previous year until the current time
- Last day -> 24 hours before “last day”
- Last week - > A week before “last week”
- Last month -> A month before “last month”
- Last year -> A year before “last year”
Additional Features
TV Mode
TV Mode allows you to view the monitoring dashboard in full-screen mode.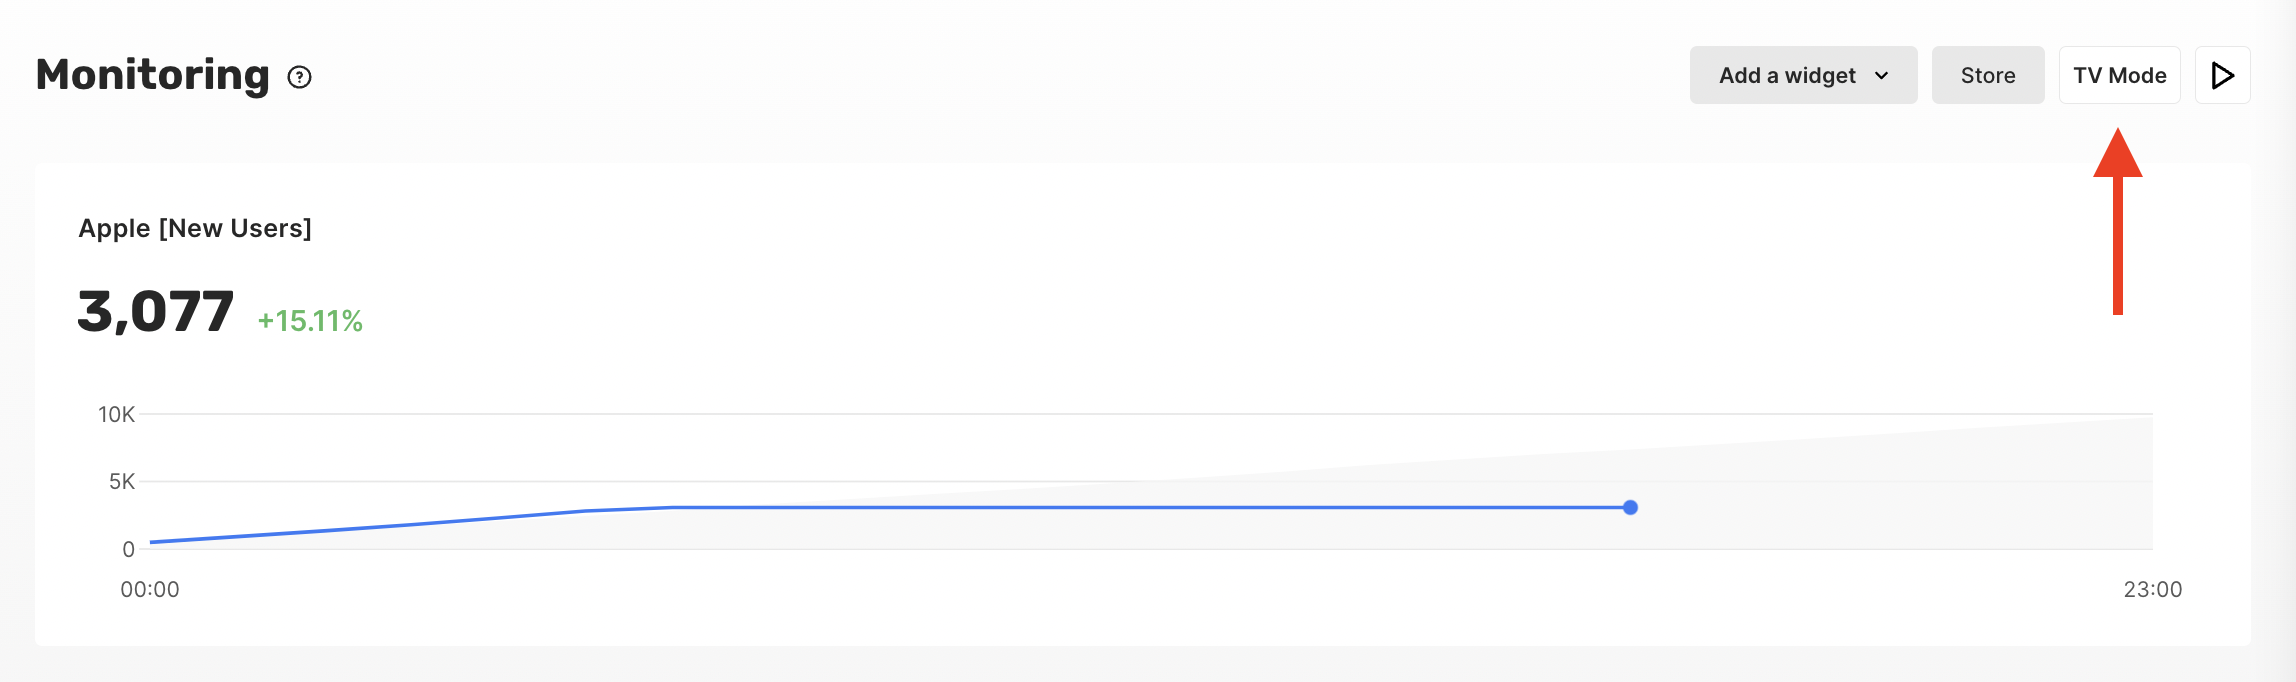
Real-time updates
You can enable real-time updates in the monitoring dashboard to analyze your metrics in real-time. The data is updated every minute.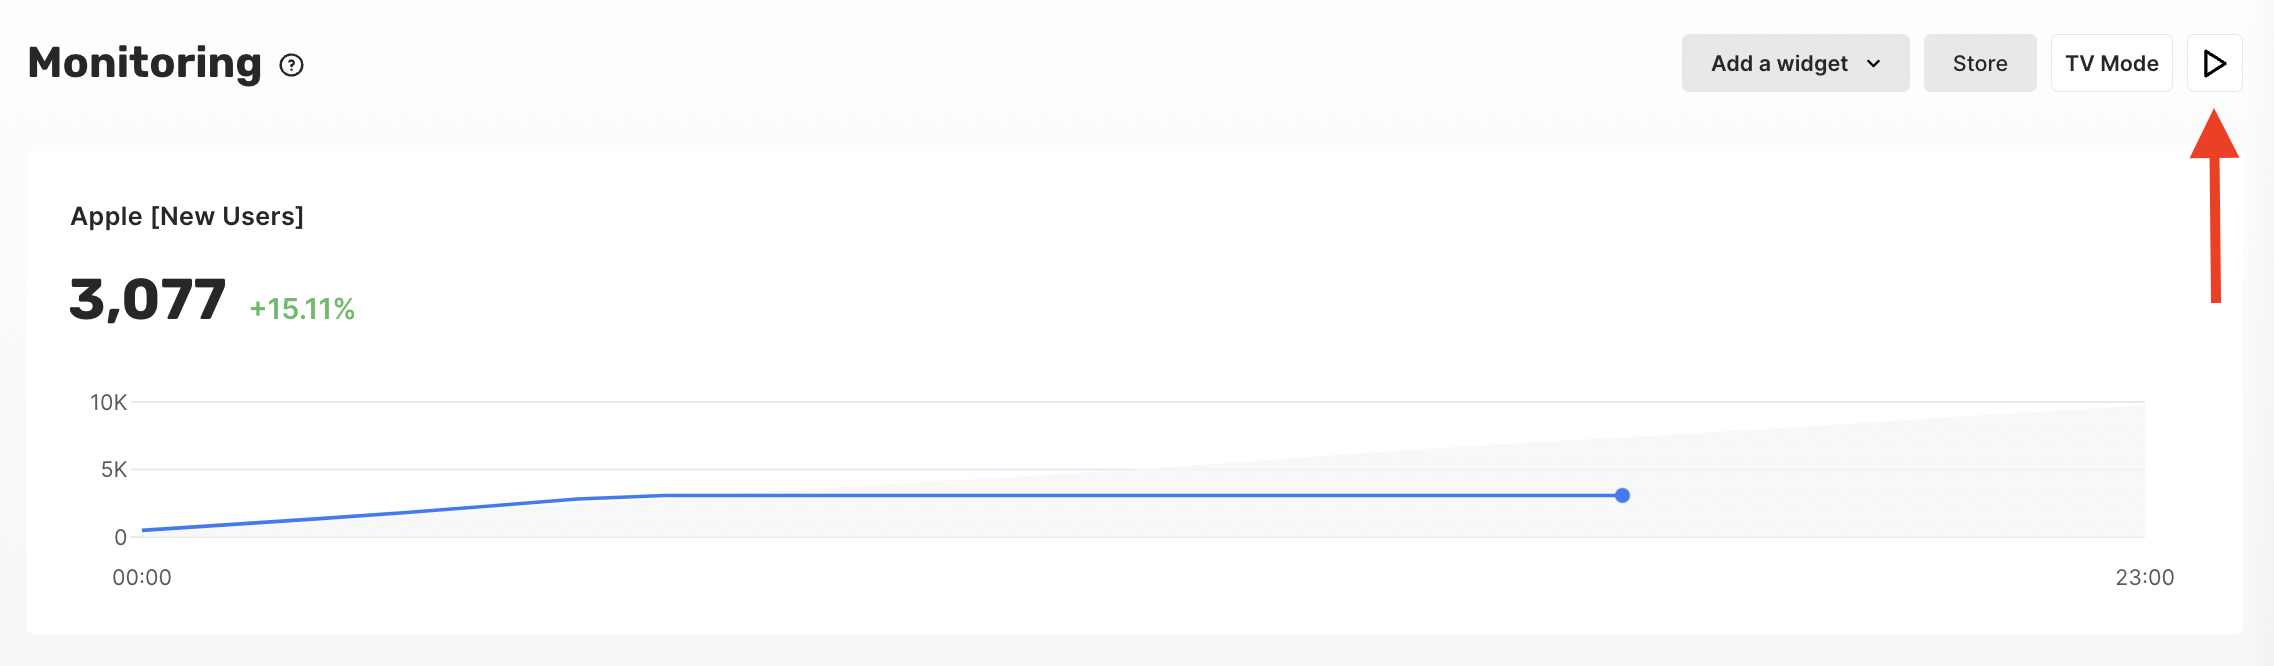
Analytics Revenue