Analyse experiments
Monitor your experiment results with real-time subscription analytics
The Analyse section in Qonversion Experiments provides the most critical experiment-related data:
- Control vs. Test Variant performance comparison
- Number of users exposed to each variant
- Number of days the experiment is running
Despite the ease of getting all the relevant experiment metrics in real-time, we highly recommend you remember the Peeking problem (checking the results and taking action before the A/B test is over). You should avoid accepting or rejecting your hypothesis before the results are statistically significant.
Results Overview
The Overview tab is the first thing you see in the Experiments Analyse tab. Use it to monitor an experiment's progress quickly.
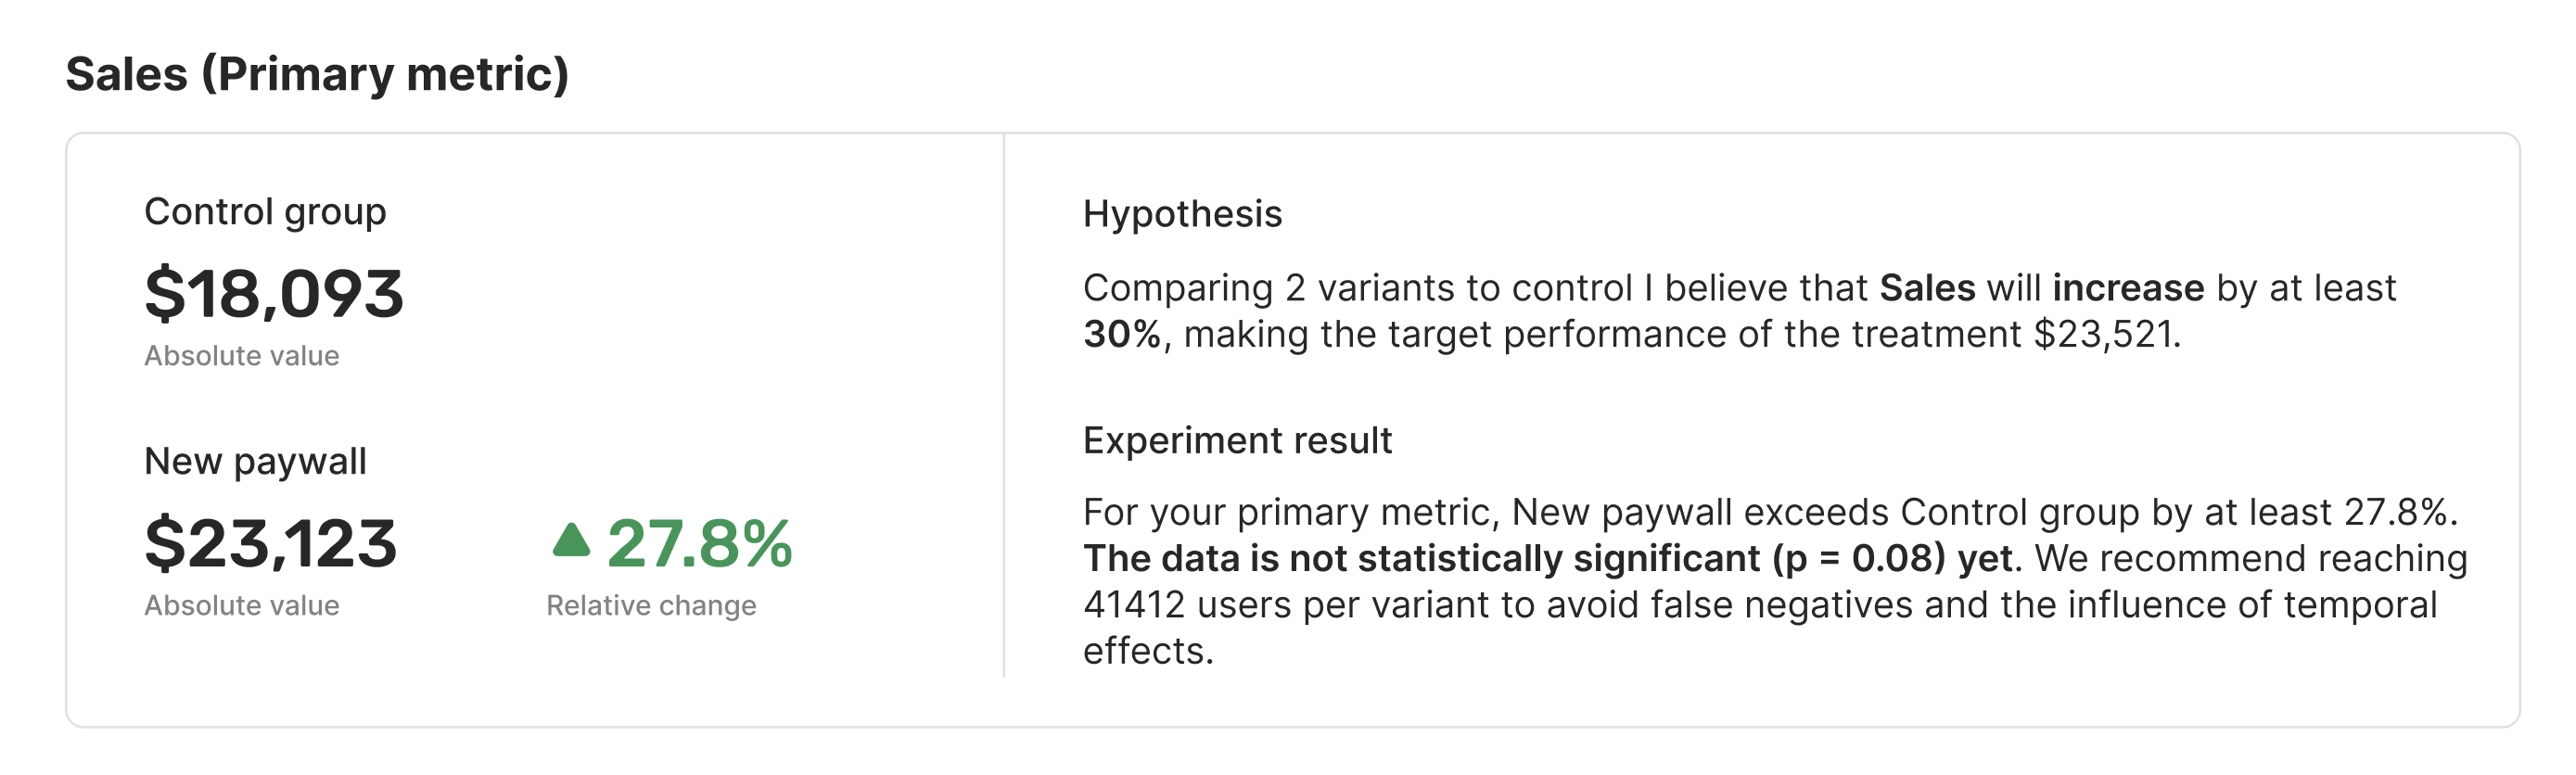
Experiment result
The Experiment result section helps you understand if your results are statistically significant. Suppose the p-value exceeds 0.05 (statistical significance is not reached). In that case, we help you know the optimal sample size per variant to minimize the risk of false negatives and the impacts of temporal effects.
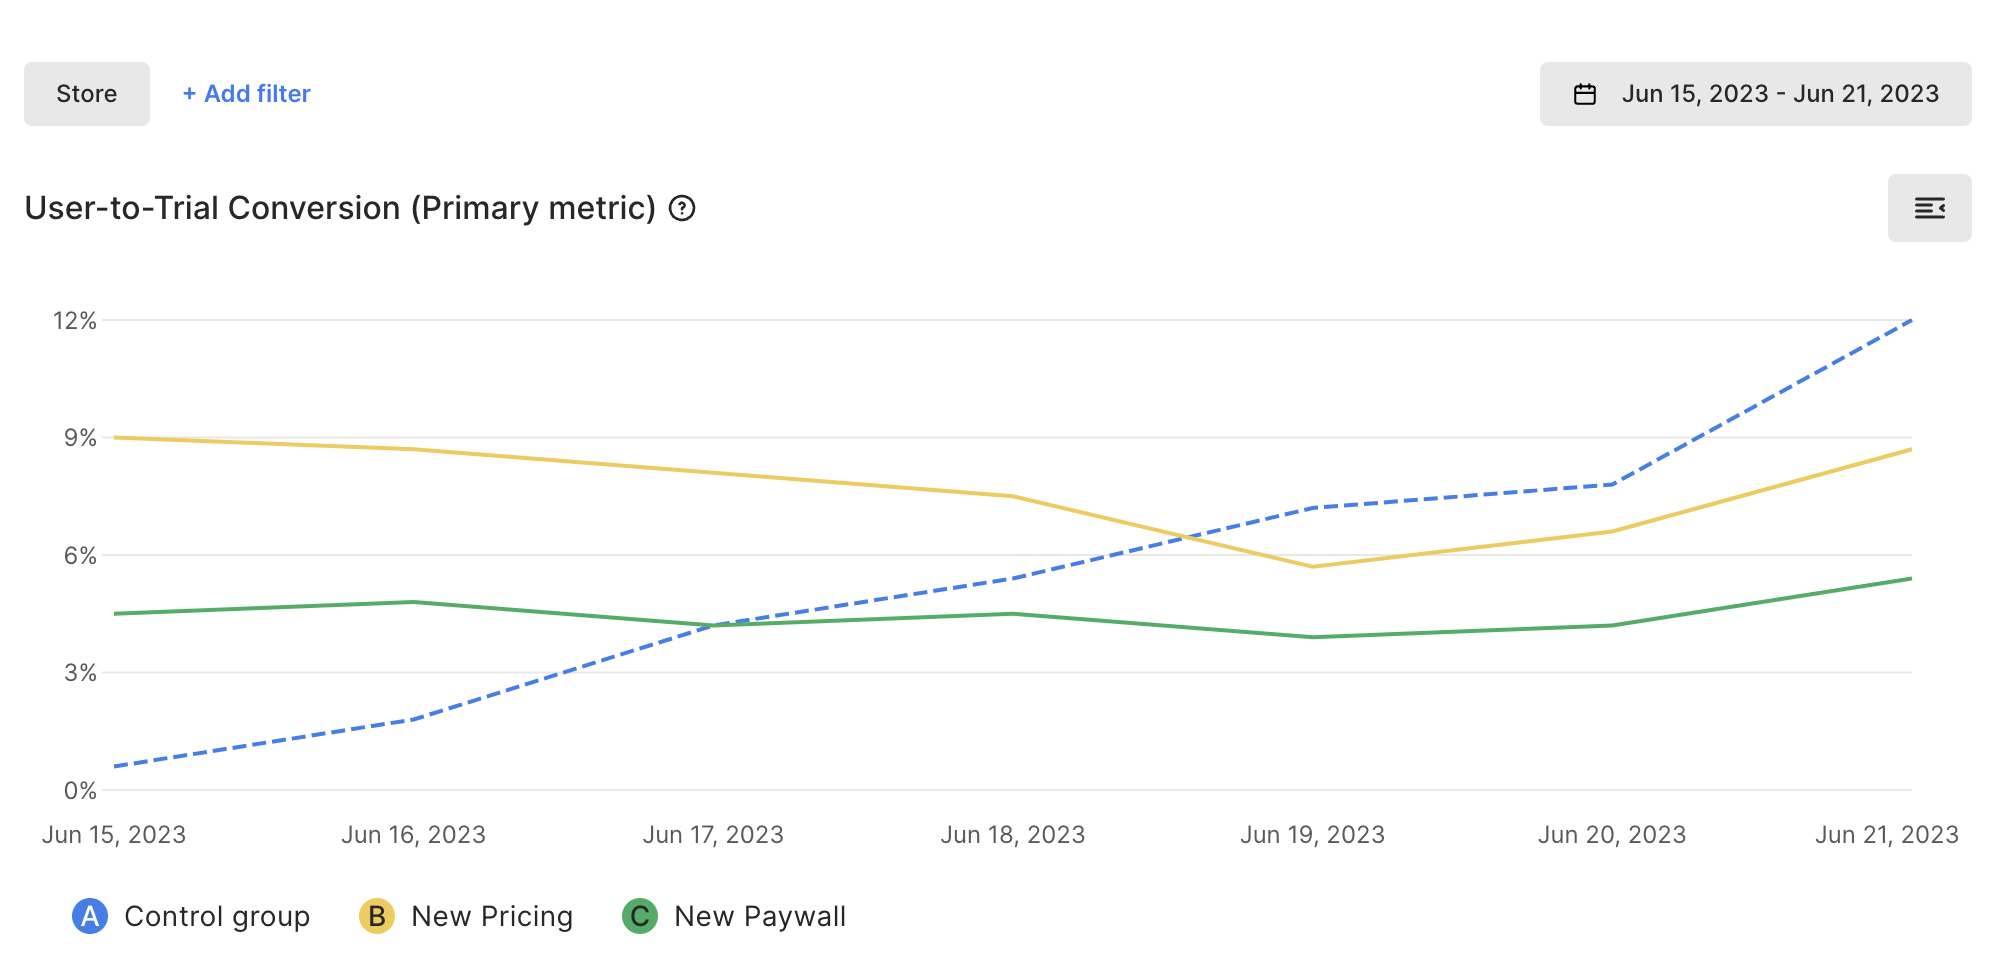
Primary metric chart
Tracking your control vs. test variants' performance during the experiment is essential. Using this chart, you can see the results of your primary metric and select different metrics for the analyses.
Please note if you see the lines constantly intersecting, that might mean that the results are not statistically significant and you couldn't accept your hypothesis.
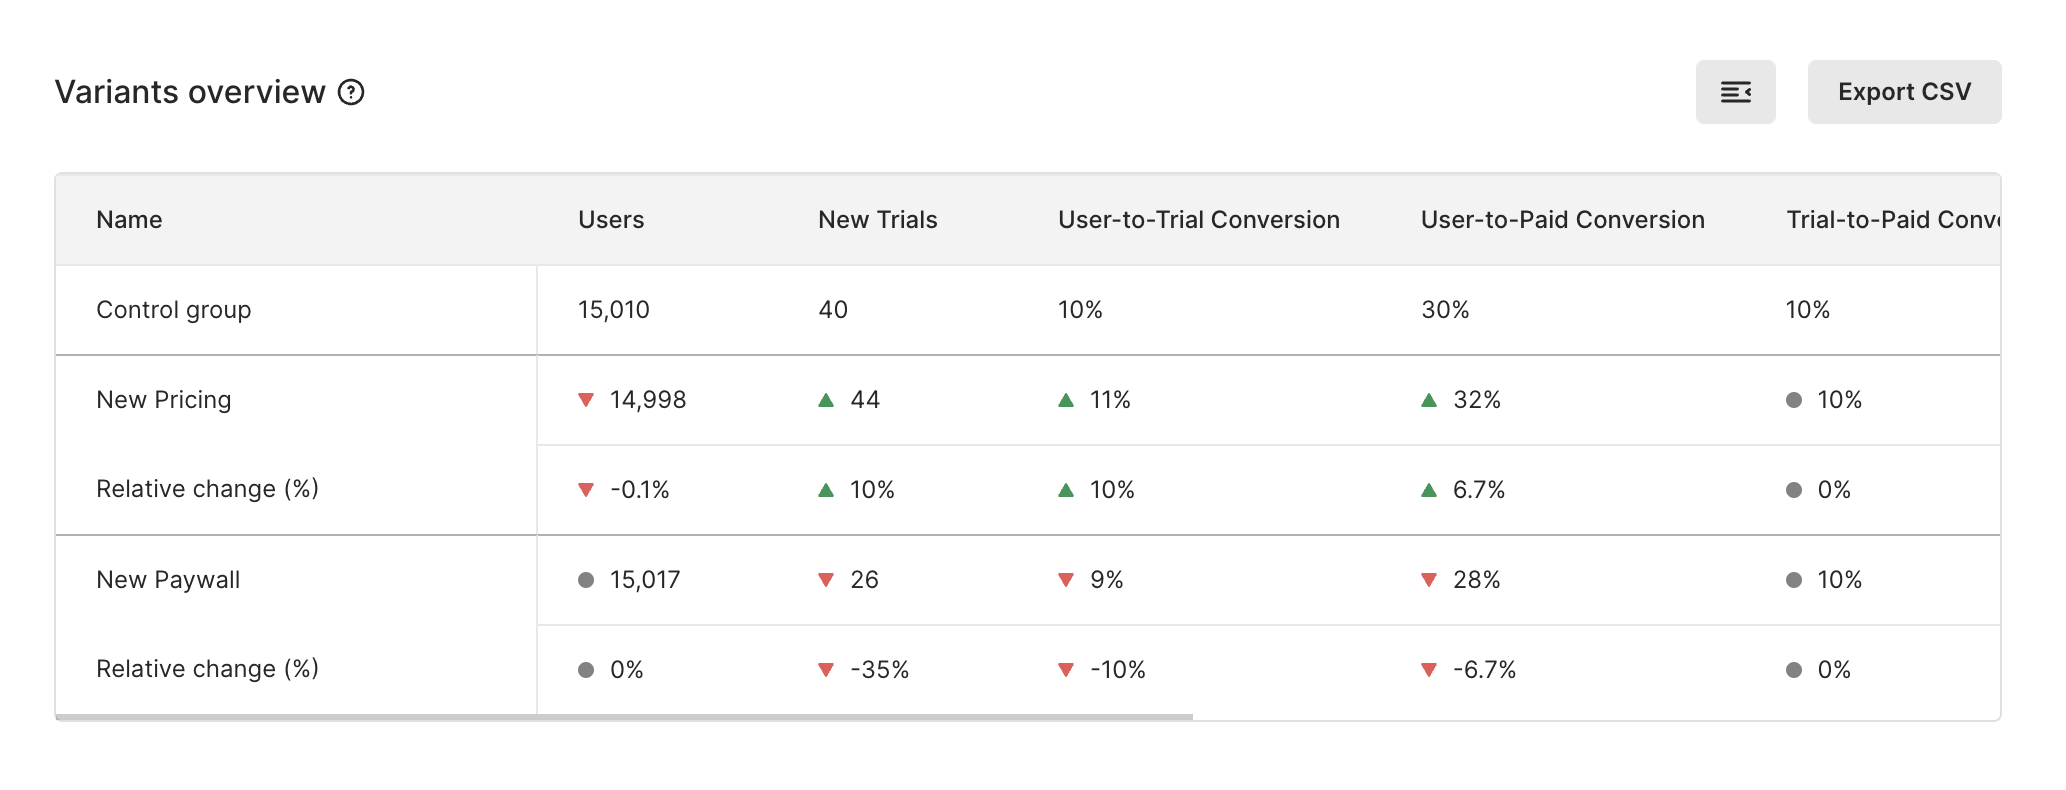
Variants overview
Though each experiment aims to improve only one specific metric, paying attention to other related metrics is essential. Set metrics up in your Variants overview table, and keep an eye on the most important ones.
Please note that data and time filtering options from the Primary metric chart apply to this table and the chart itself.
Metrics you can analyze with Qonversion Experiments
Users
Calculates as the number of users assigned to the specific variant.
User-to-Trial Conversion
Calculates as the number of Trial Started events divided by the number of users assigned to the specific variant.
→ Numerator: Trial Started events from the cohort of users assigned to the variant for the selected period.
→ Denominator: Number of users assigned to the variant for the selected period.
User-to-Paid Conversion
Calculates as the number of revenue (Trial Converted, Subscription Started & In-App Purchase) events divided by the number of users assigned to the specific variant.
→ Numerator: Trial Converted, Subscription Started & In-App Purchase events from the cohort of users assigned to the variant for the selected period.
→ Denominator: Number of users assigned to the variant for the selected period.
New Trials
Calculates as the number of Trial Started events from the cohort of users assigned to the variant for the selected period.
Trial-to-Paid Conversion
Calculates as the number of Trial Converted events divided by the number of Trial Started events from the cohort of users assigned to the specific variant.
→ Numerator: Trial Converted events attributed to Trial Started events.
→ Denominator: Trial Started events from the cohort of users assigned to the specific variant.
Trials Cancellation Rate
Calculates as the number of Trial Canceled events divided by the number of Trial Started events from the cohort of users assigned to the specific variant.
→ Numerator: Trial Canceled events attributed to Trial Started events.
→ Denominator: Trial Started events from the cohort of users assigned to the specific variant.
New Subscriptions
Calculates as the number of Subscription Started events from the cohort of users assigned to the variant for the selected period.
Subscriptions Cancellation Rate
Calculates as the number of Subscription Canceled events divided by the number of Subscription Started events from the cohort of users assigned to the specific variant.
→ Numerator: Subscription Canceled events attributed to SubscriptionStarted events.
→ Denominator: Subscription Started events from the cohort of users assigned to the specific variant.
Sales
Calculates as revenue (after deducting refunds) from the cohort of users assigned to the variant for the selected period.
Proceeds
Calculates as Sales after deducting App Stores' commission from the cohort of users assigned to the variant for the selected period.
Refunds
Calculates as refund sum from the cohort of users assigned to the variant for the selected period.
Updated 7 months ago