> ## Documentation Index
> Fetch the complete documentation index at: https://documentation.qonversion.io/llms.txt
> Use this file to discover all available pages before exploring further.
# Screen Analytics
> Track how your no-code screens perform — impressions, conversions, revenue, and more.
Qonversion Screen Analytics gives you a complete view of how your no-code screens perform. See which screens drive the most revenue, where users convert or drop off, and how different audiences engage with your paywalls and onboarding flows.
Tracking is fully automatic — once you update your SDK, data starts flowing with no additional setup.
Screen Analytics requires the following minimum SDK versions:
| Platform | Minimum Version |
| -------- | --------------- |
| iOS | 6.7.0 |
| Android | No-Codes 1.6.0 |
If you're using an older SDK version, update to start collecting screen analytics data.
***
## Overview
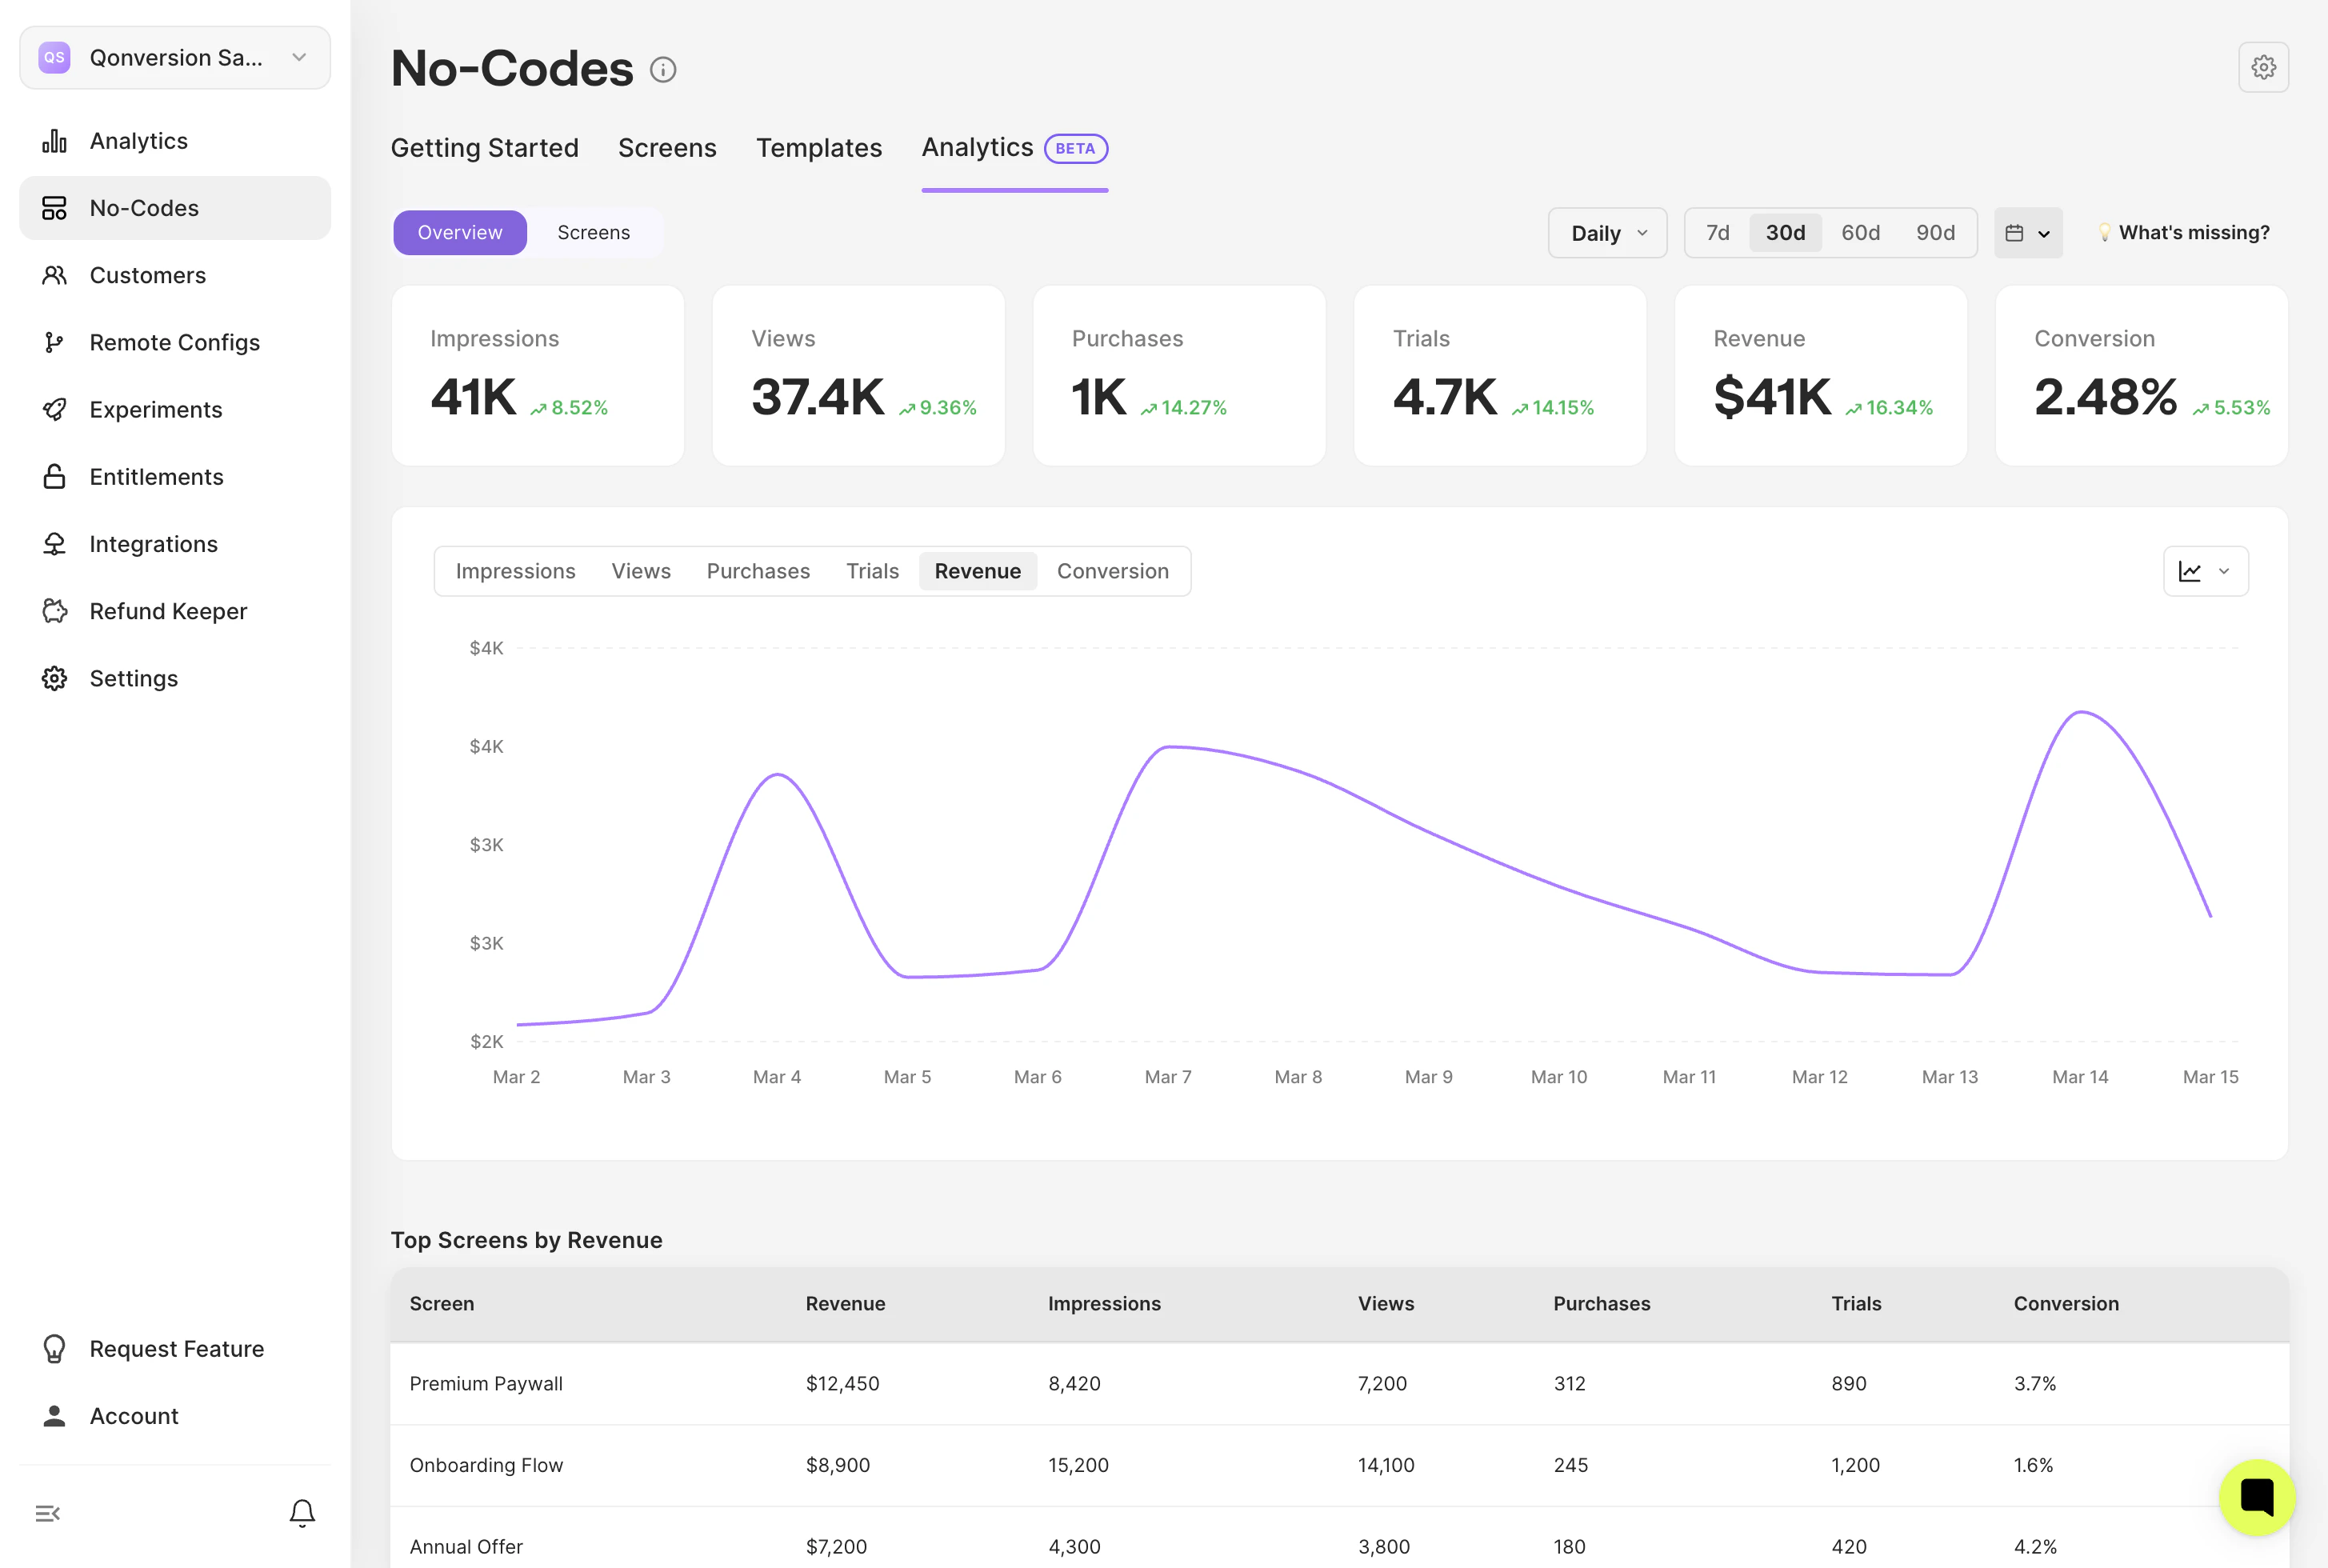
The Overview tab provides a high-level snapshot of how all your no-code screens perform together.
### KPI Cards
Six metric cards are displayed at the top, each showing the current value and a comparison to the previous period:
| Metric | Description |
| --------------- | ----------------------------------------------------- |
| **Impressions** | Total number of times screens were loaded |
| **Views** | Number of user interactions with screens |
| **Purchases** | Completed purchase events from screens |
| **Trials** | Trial subscription starts from screens |
| **Revenue** | Total revenue generated from screens (USD) |
| **Conversion** | Percentage of impressions that resulted in a purchase |
### Performance Chart
Below the KPI cards, an interactive chart lets you visualize any metric over time:
* **Metric switcher** — toggle between Impressions, Views, Purchases, Trials, Revenue, and Conversion
* **Chart types** — Line, Area, or Vertical Bar
* **Time unit** — Day, Week, or Month
### Top Screens
A leaderboard table shows your top 5 screens ranked by revenue. Each row displays the screen name along with all six metrics. Click any row to open its detail page.
 ***
## Screens
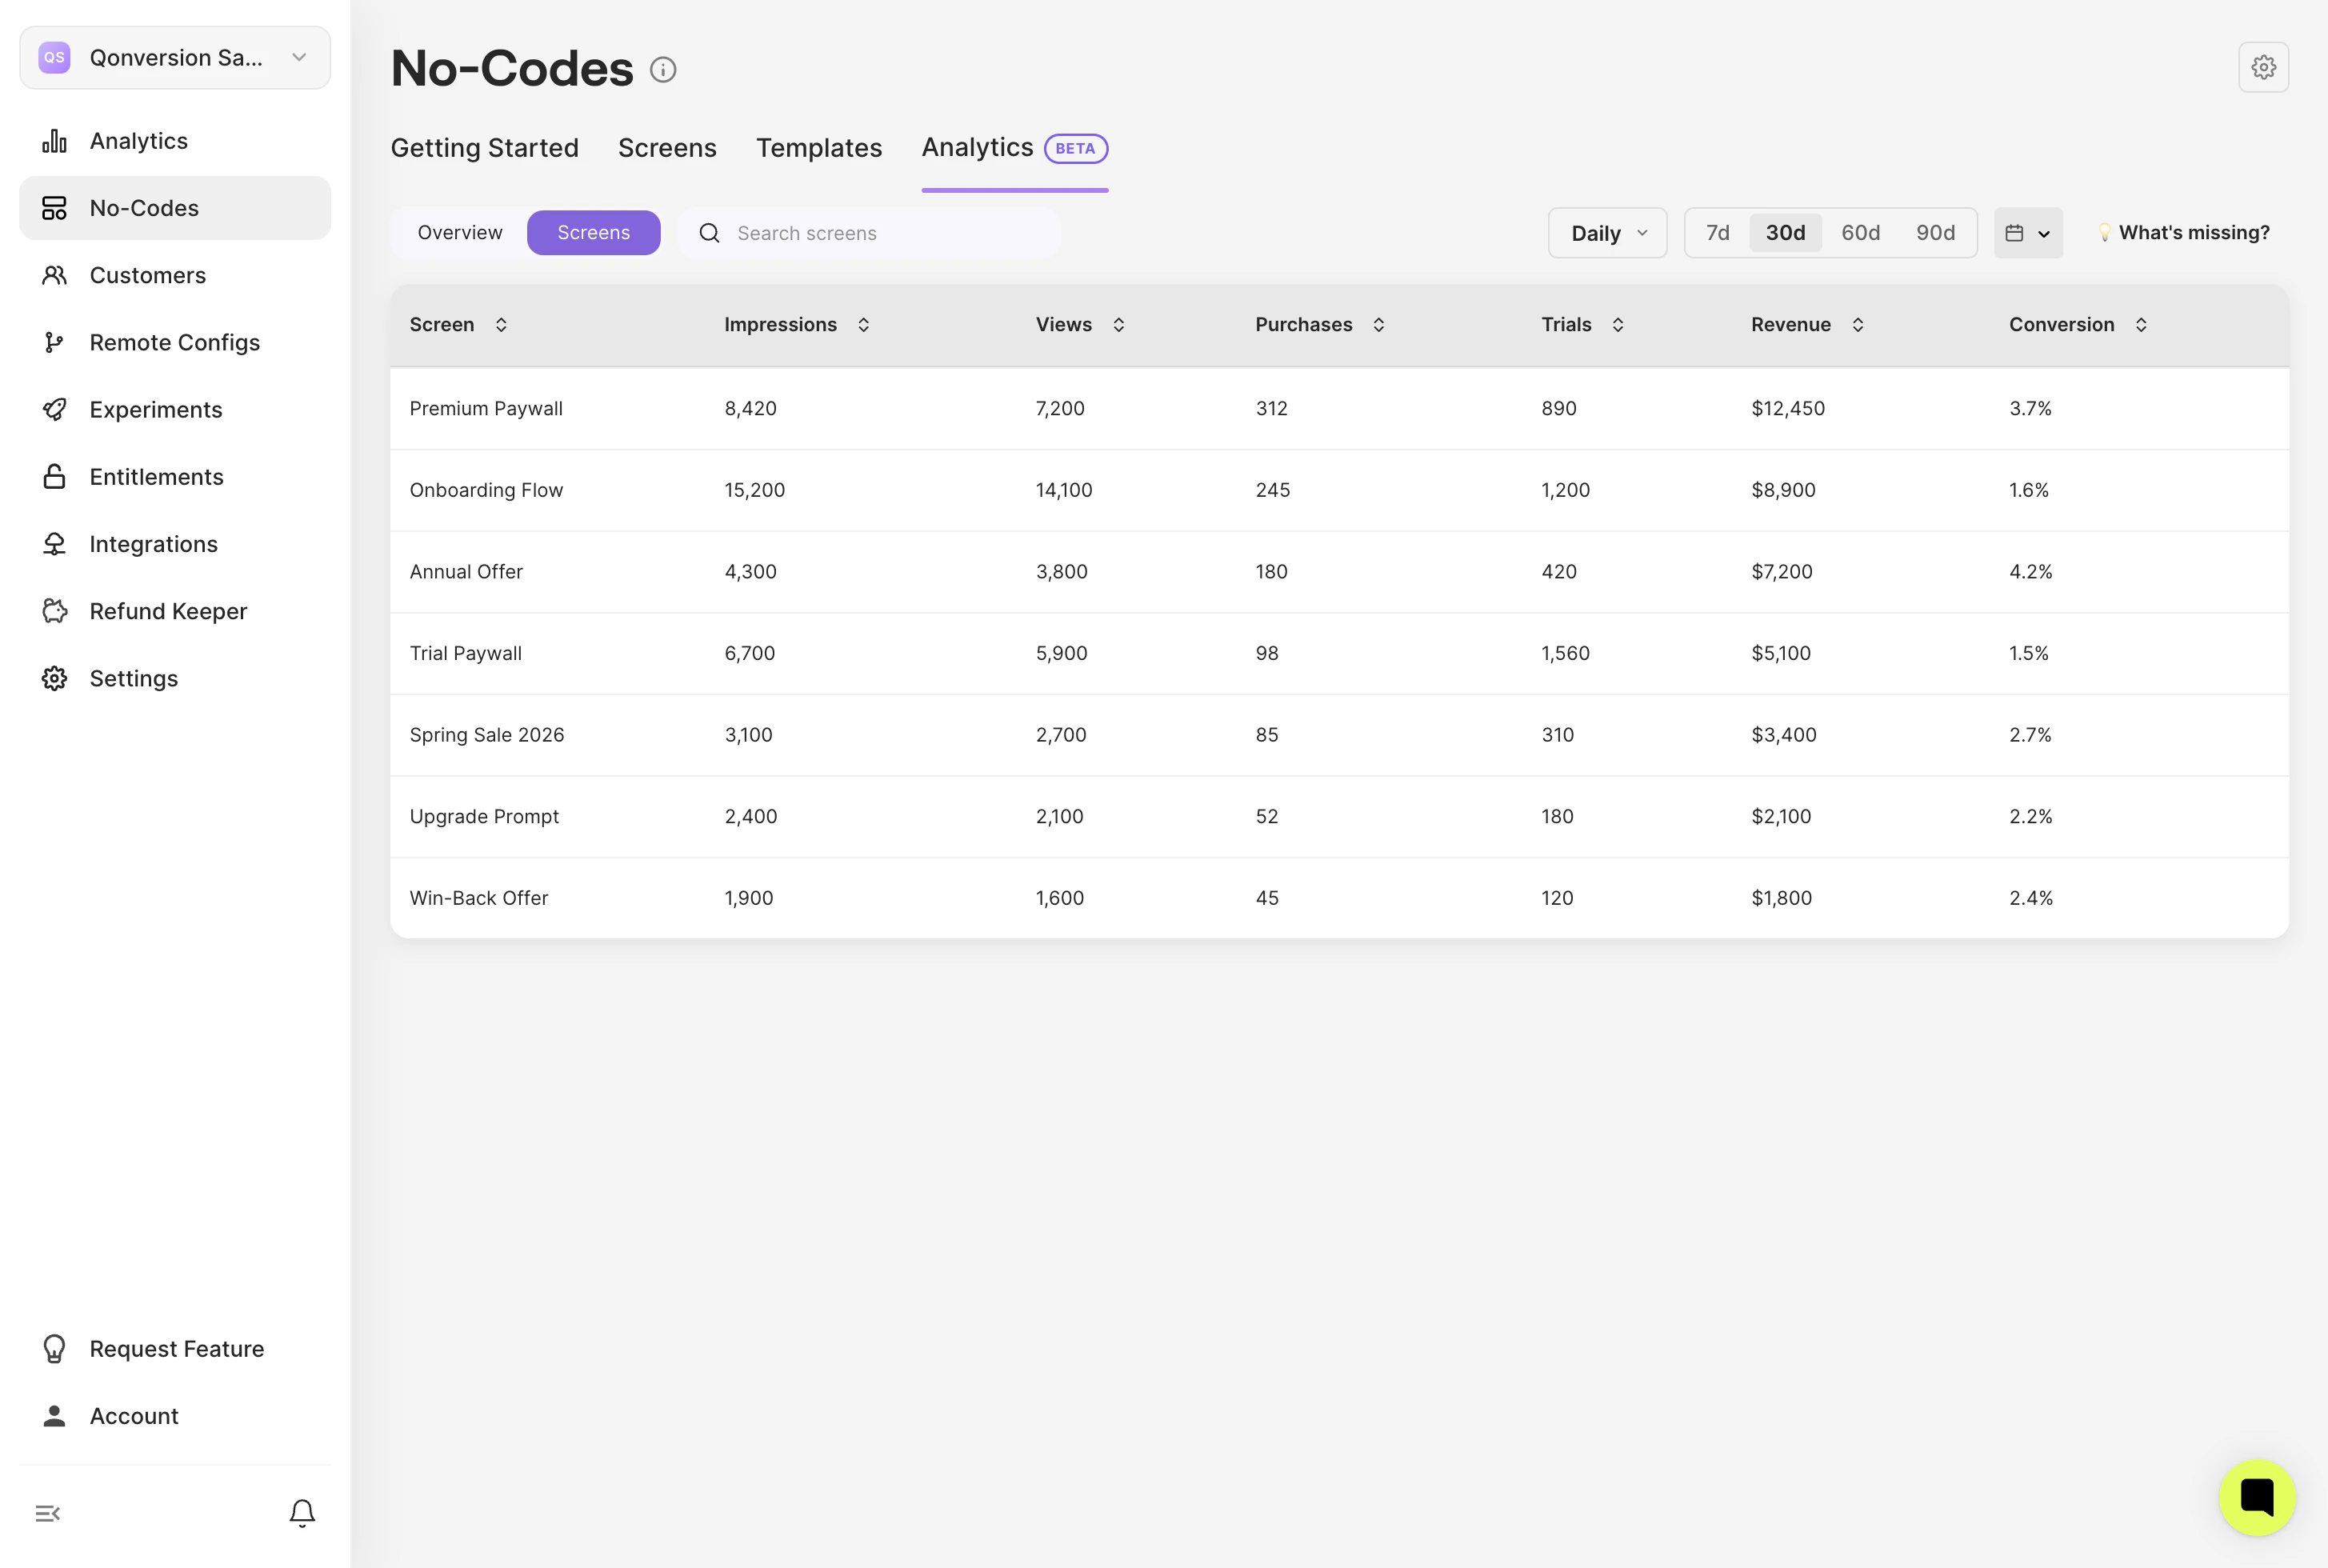
The Screens tab shows a full table of all your no-code screens with their performance data.
* **Columns**: Screen, Impressions, Views, Purchases, Trials, Revenue, Conversion
* **Sort**: Click any column header to sort - cycle is ascending → descending → unsorted. The Top Screens widget on Overview is always ranked by Revenue (descending)
* **Search**: Find screens by name
* **Pagination**: Browse through all screens, 10 per page
Click any row to open the screen's detail page.
***
## Screens
The Screens tab shows a full table of all your no-code screens with their performance data.
* **Columns**: Screen, Impressions, Views, Purchases, Trials, Revenue, Conversion
* **Sort**: Click any column header to sort - cycle is ascending → descending → unsorted. The Top Screens widget on Overview is always ranked by Revenue (descending)
* **Search**: Find screens by name
* **Pagination**: Browse through all screens, 10 per page
Click any row to open the screen's detail page.
 ***
## Screen Detail
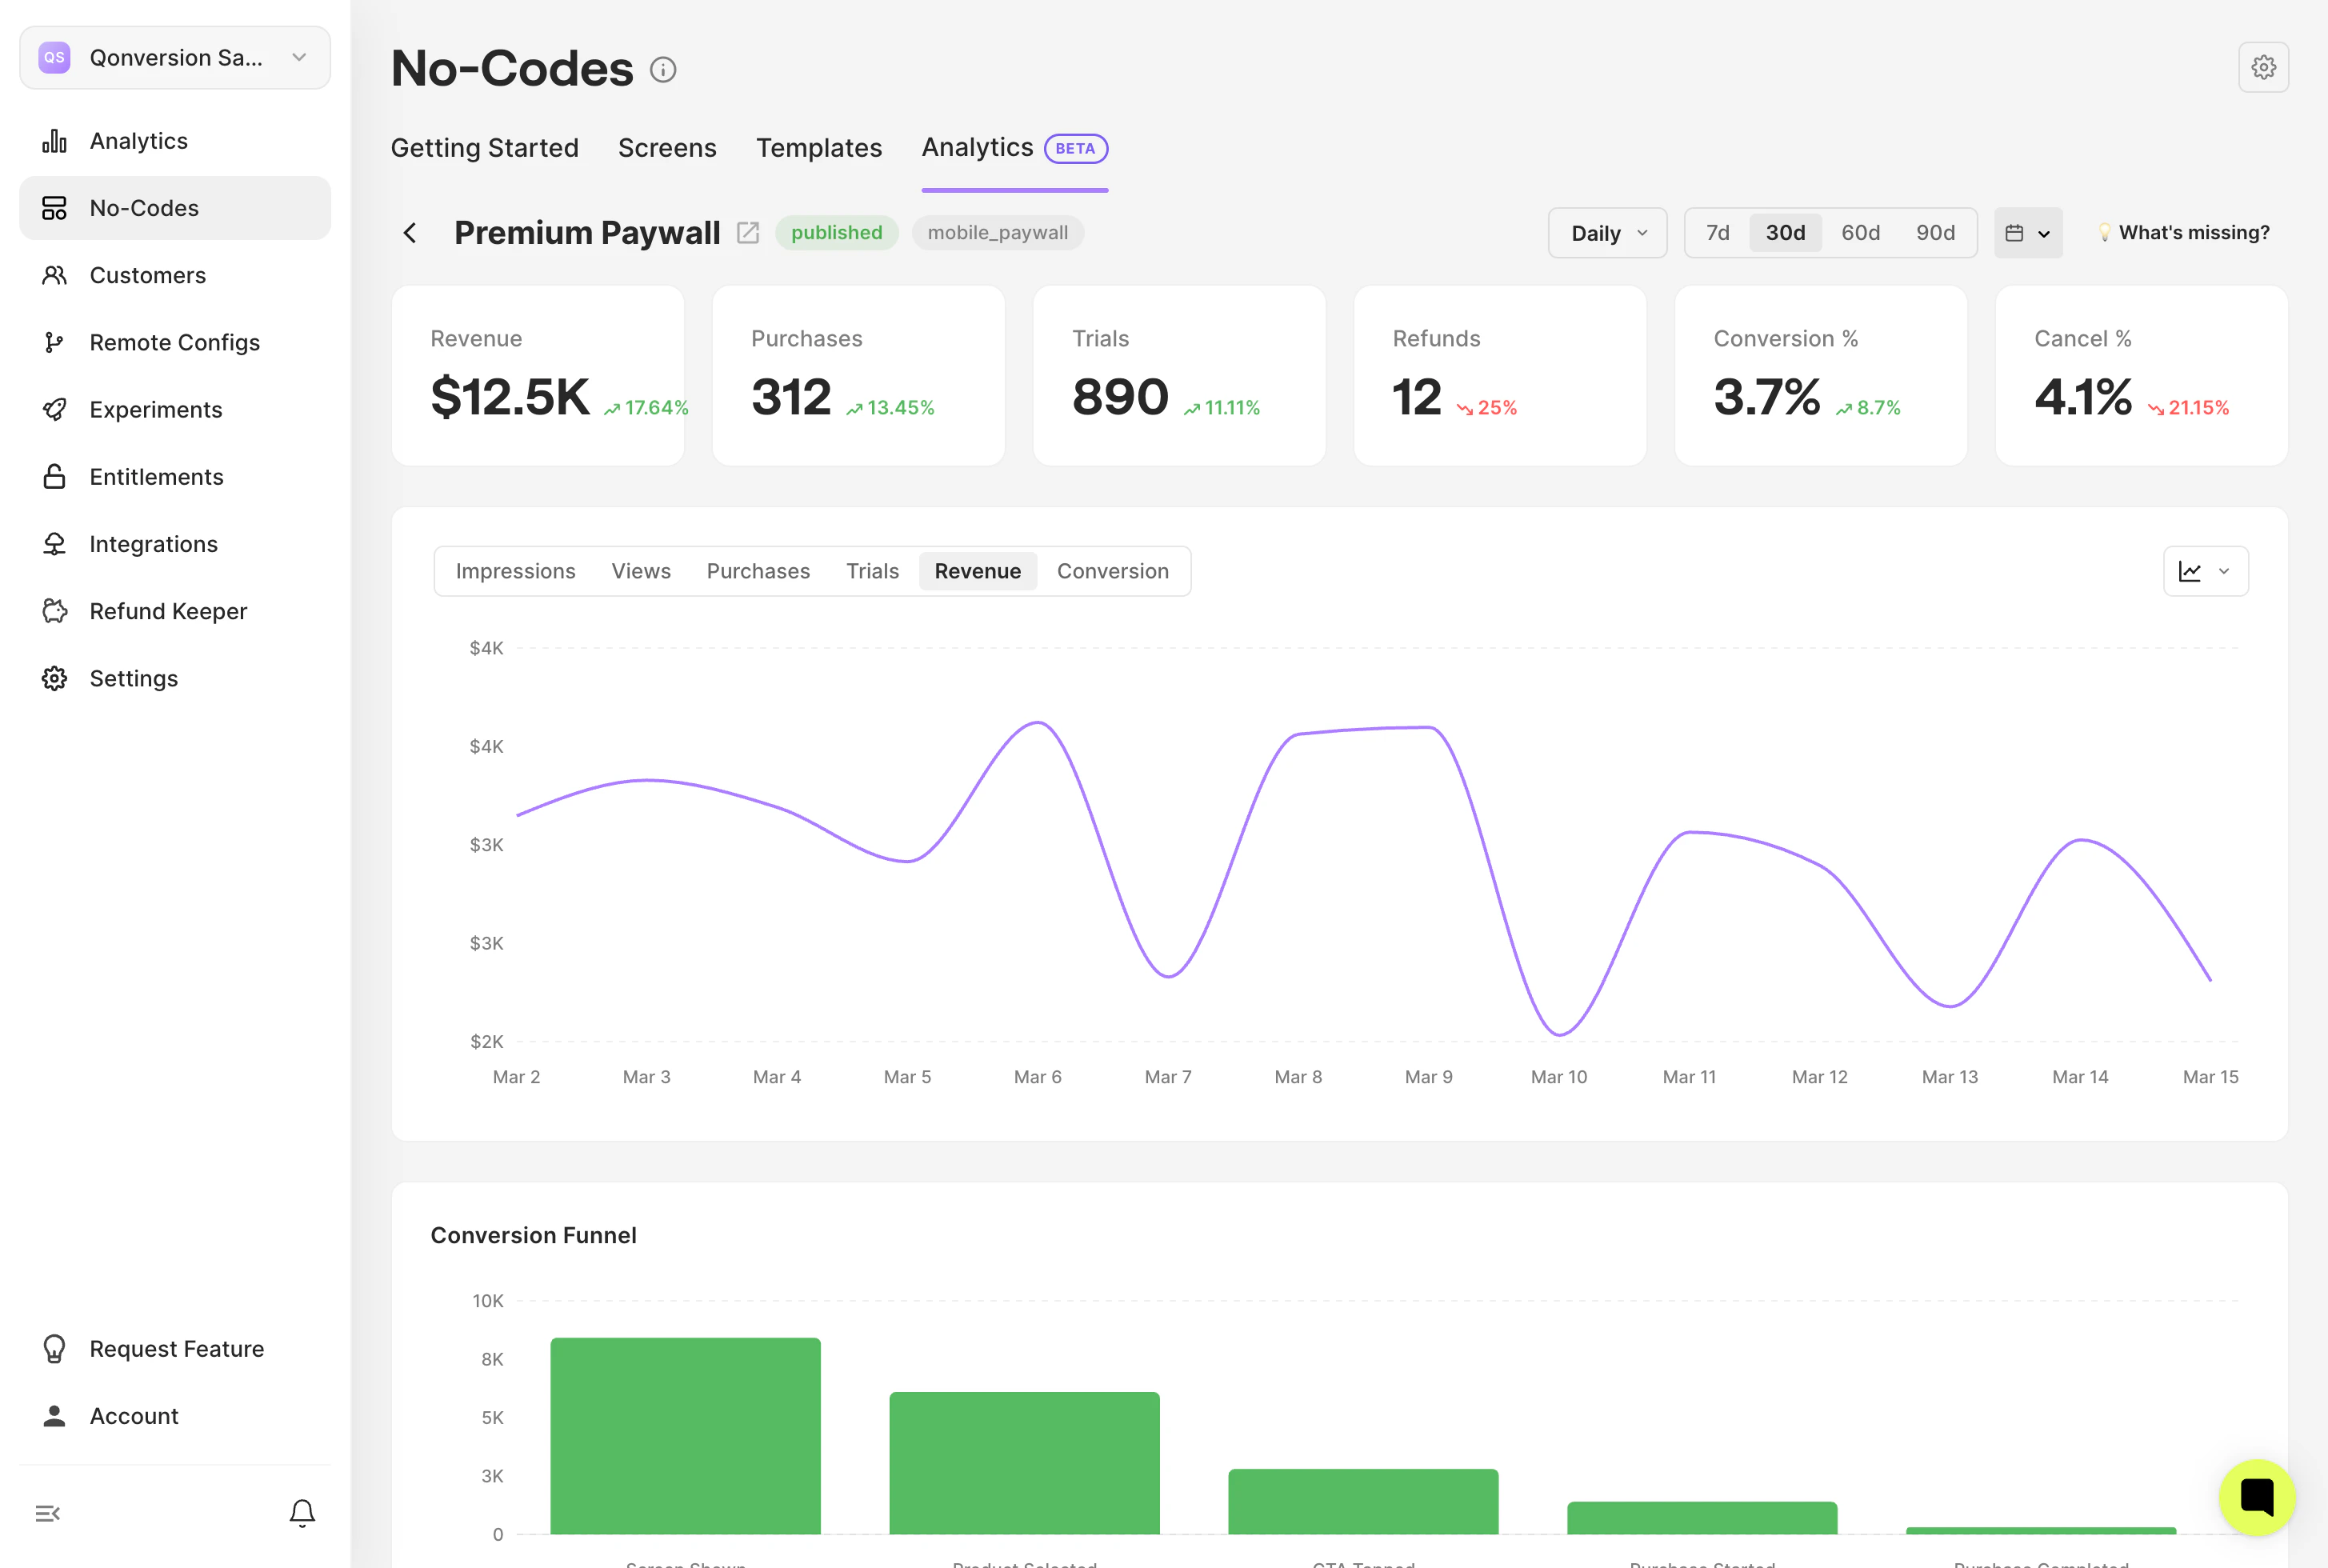
Click on any screen to see its detailed analytics. The detail page provides deep insights into a single screen's performance.
### KPI Cards
Six metric cards with delta comparison to the previous period:
| Metric | Description |
| ---------------- | ------------------------------------------------ |
| **Revenue** | Total revenue generated by this screen (USD) |
| **Purchases** | Completed purchase events |
| **Trials** | Trial starts from this screen |
| **Refunds** | Reversed purchases |
| **Conversion %** | Percentage of impressions that led to a purchase |
| **Cancel %** | Percentage of purchases that were refunded |
### Performance Chart
A time-series chart for this specific screen. Supports the same controls as the Overview chart — metric toggle, chart types, and time unit selector.
***
## Screen Detail
Click on any screen to see its detailed analytics. The detail page provides deep insights into a single screen's performance.
### KPI Cards
Six metric cards with delta comparison to the previous period:
| Metric | Description |
| ---------------- | ------------------------------------------------ |
| **Revenue** | Total revenue generated by this screen (USD) |
| **Purchases** | Completed purchase events |
| **Trials** | Trial starts from this screen |
| **Refunds** | Reversed purchases |
| **Conversion %** | Percentage of impressions that led to a purchase |
| **Cancel %** | Percentage of purchases that were refunded |
### Performance Chart
A time-series chart for this specific screen. Supports the same controls as the Overview chart — metric toggle, chart types, and time unit selector.
 ***
### Conversion Funnel
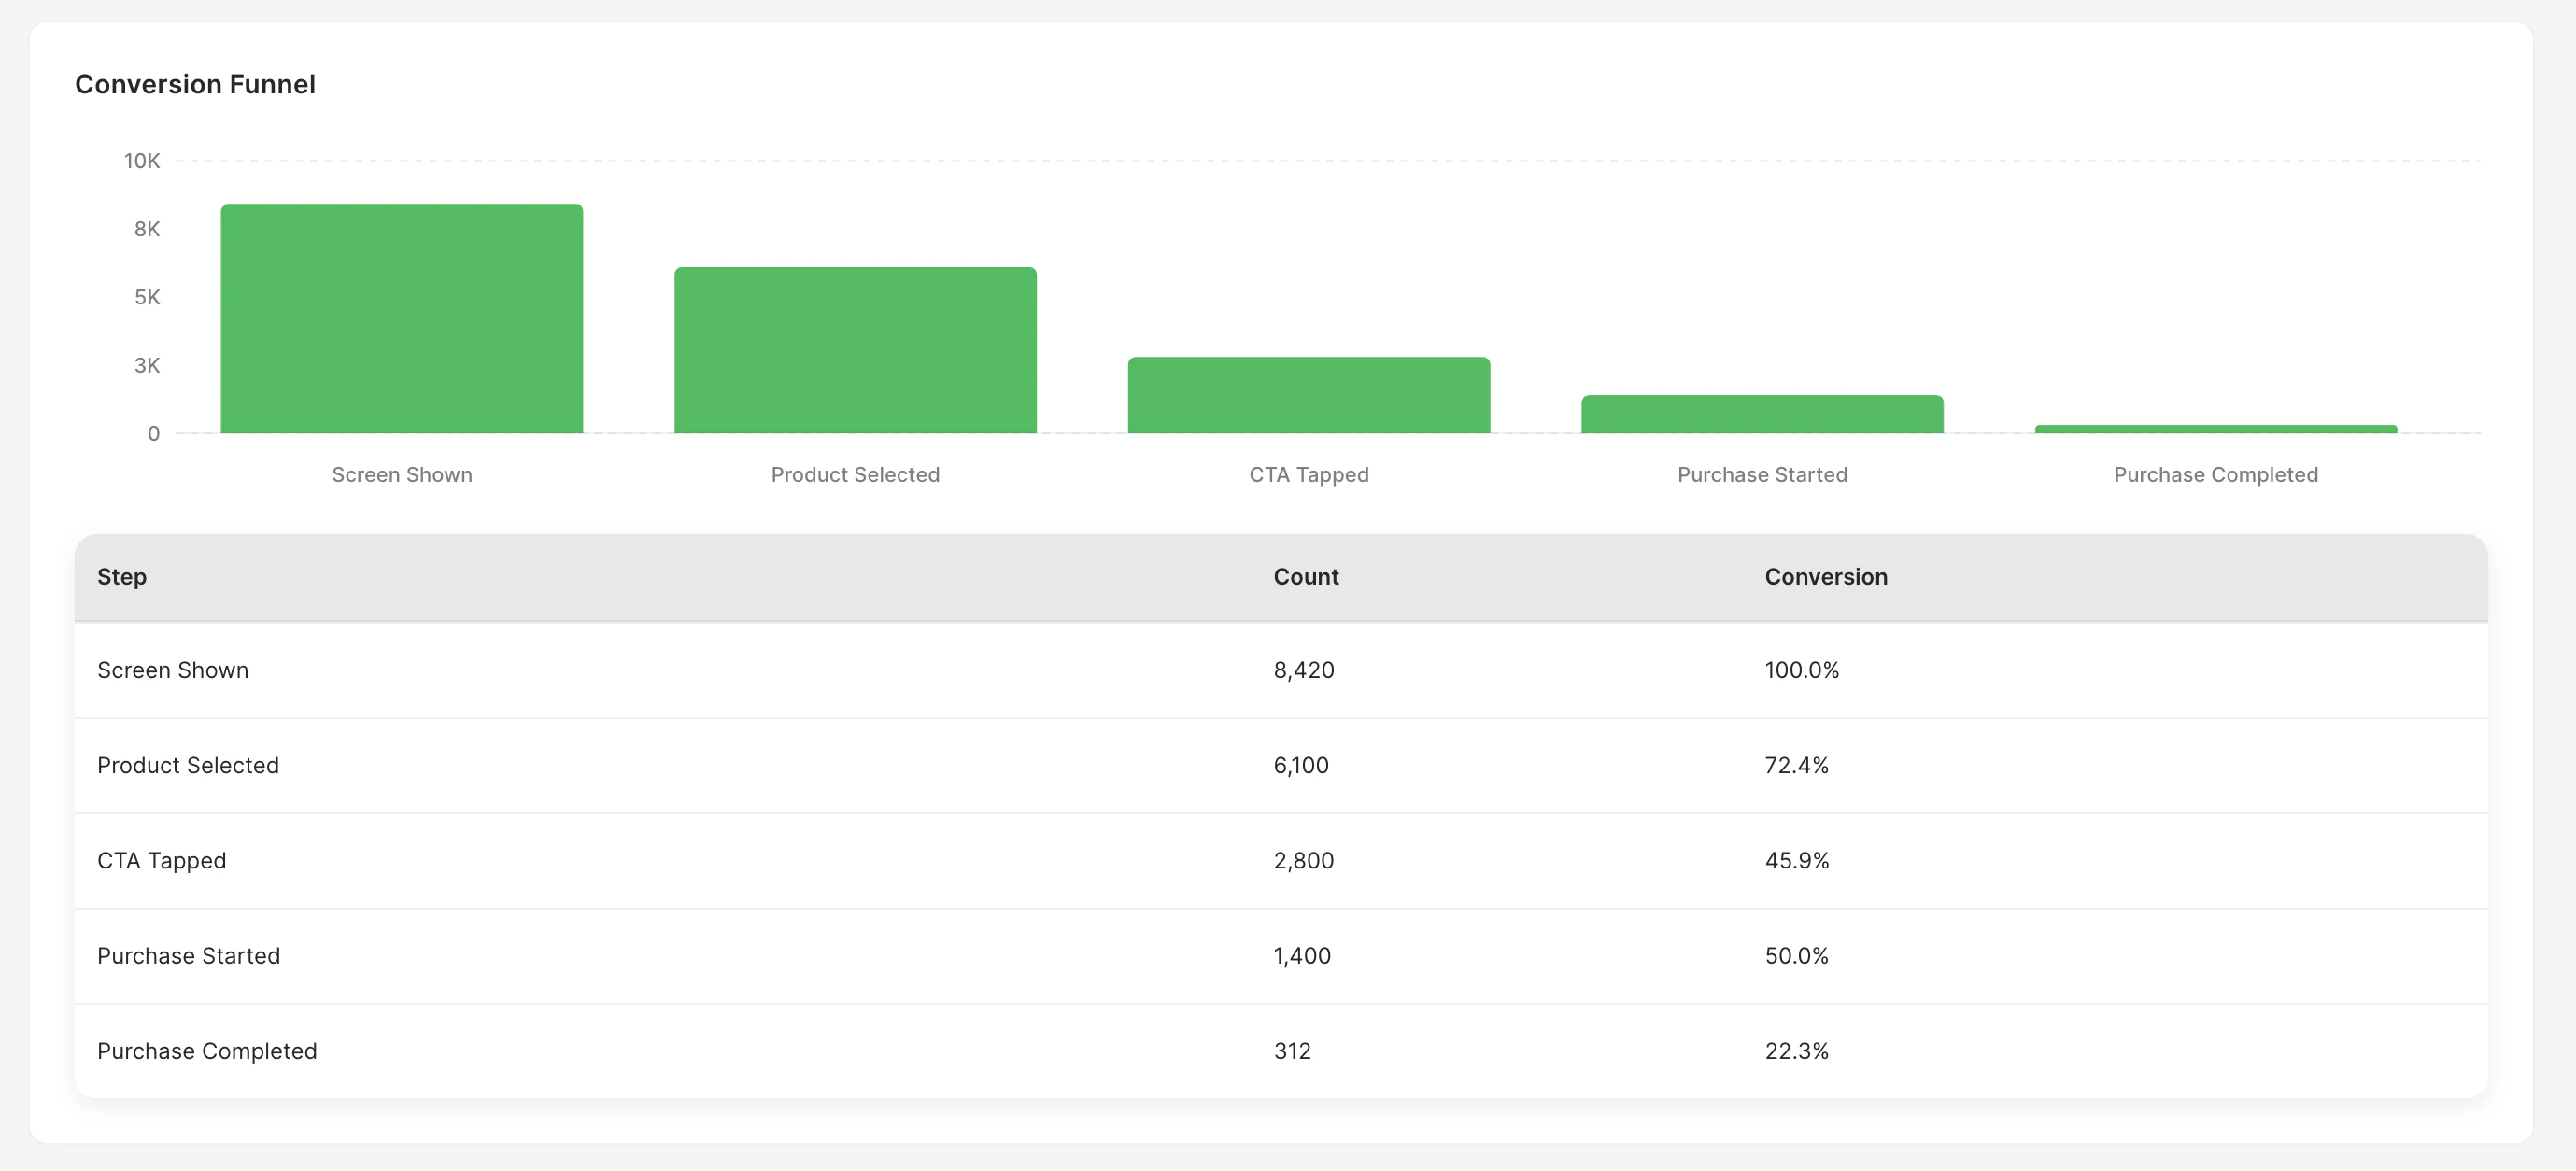
See how users progress through your screen step by step.
* A bar chart shows the count at each step
* A table displays each step with the count and conversion percentage from the previous step
This helps you identify where users drop off and which steps need improvement.
***
### Conversion Funnel
See how users progress through your screen step by step.
* A bar chart shows the count at each step
* A table displays each step with the count and conversion percentage from the previous step
This helps you identify where users drop off and which steps need improvement.
 ***
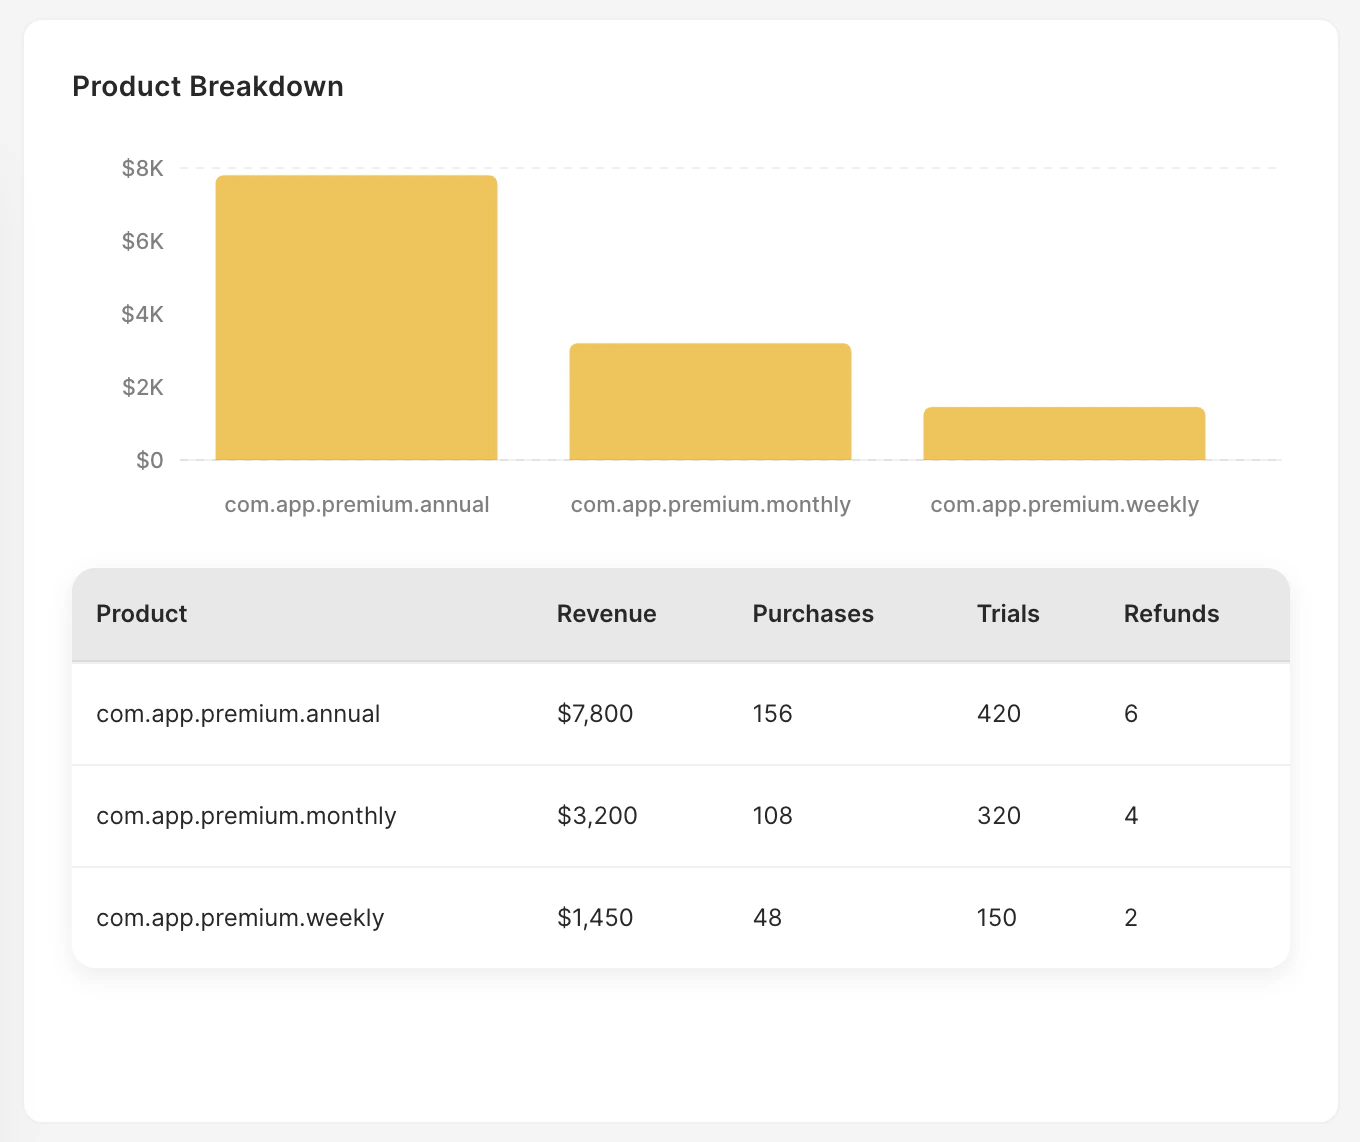
### Product Breakdown
Understand which products generate the most revenue from this screen.
* A bar chart compares revenue across products
* A table shows Product ID, Revenue, Purchases, Trials, and Refunds for each product
***
### Product Breakdown
Understand which products generate the most revenue from this screen.
* A bar chart compares revenue across products
* A table shows Product ID, Revenue, Purchases, Trials, and Refunds for each product
 ***
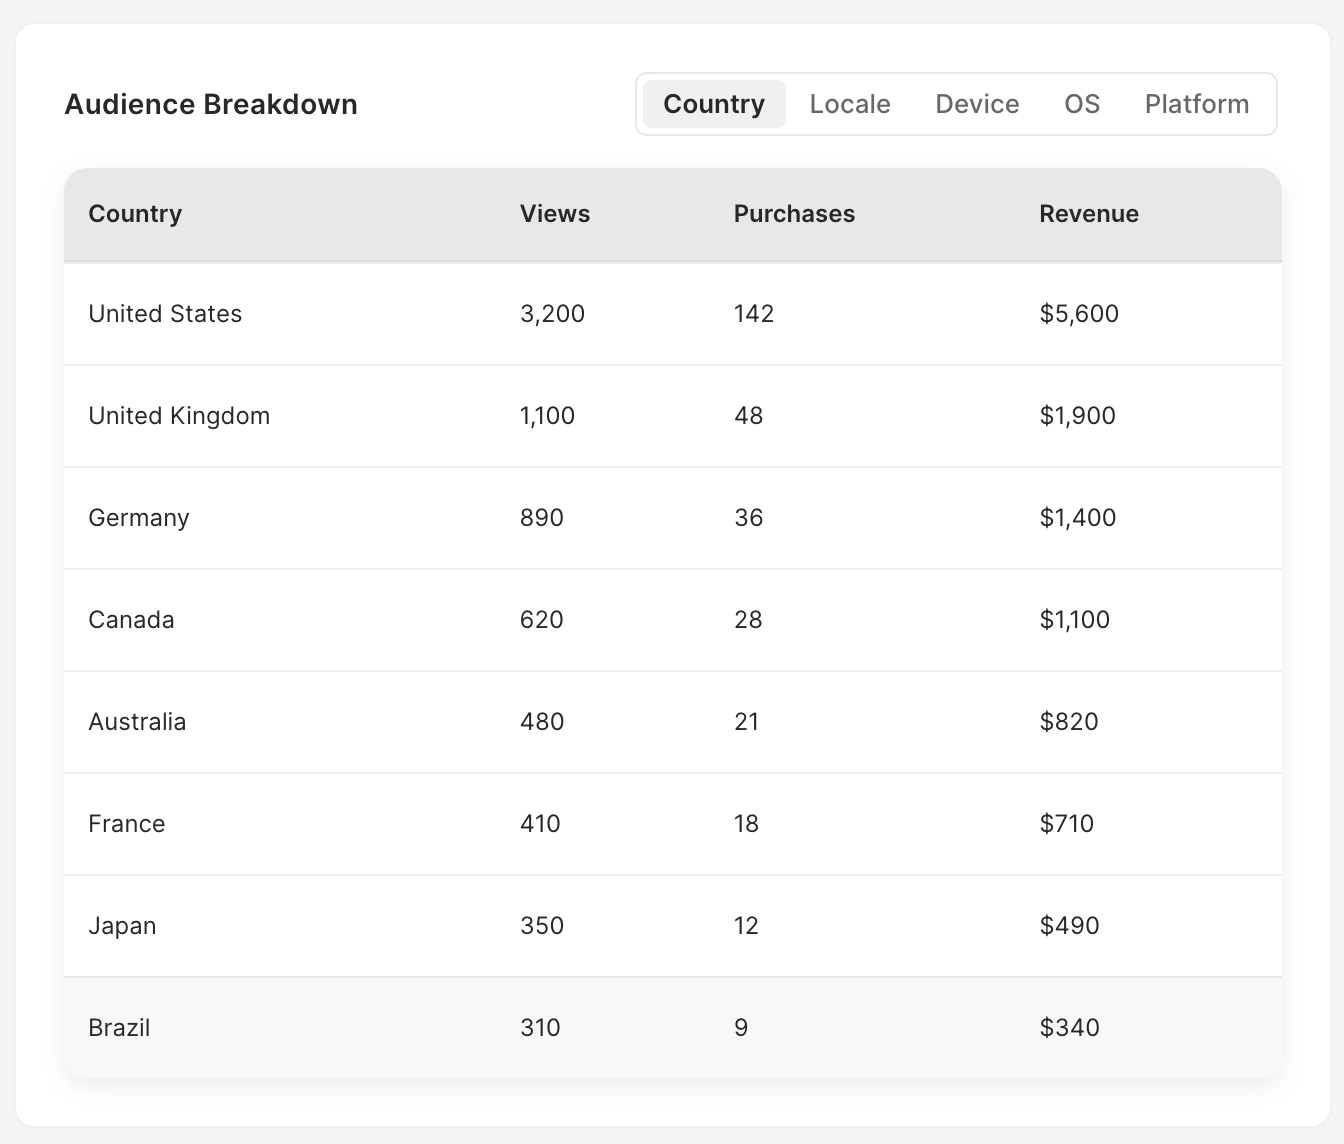
### Audience Breakdown
Segment your screen's performance by audience dimensions:
* **Country** — where your users are located
* **Locale** — device language
* **Device** — device model
* **OS** — operating system version
* **Platform** — iOS or Android
Each dimension shows a table with Views, Purchases, and Revenue per segment.
***
### Audience Breakdown
Segment your screen's performance by audience dimensions:
* **Country** — where your users are located
* **Locale** — device language
* **Device** — device model
* **OS** — operating system version
* **Platform** — iOS or Android
Each dimension shows a table with Views, Purchases, and Revenue per segment.
 ***
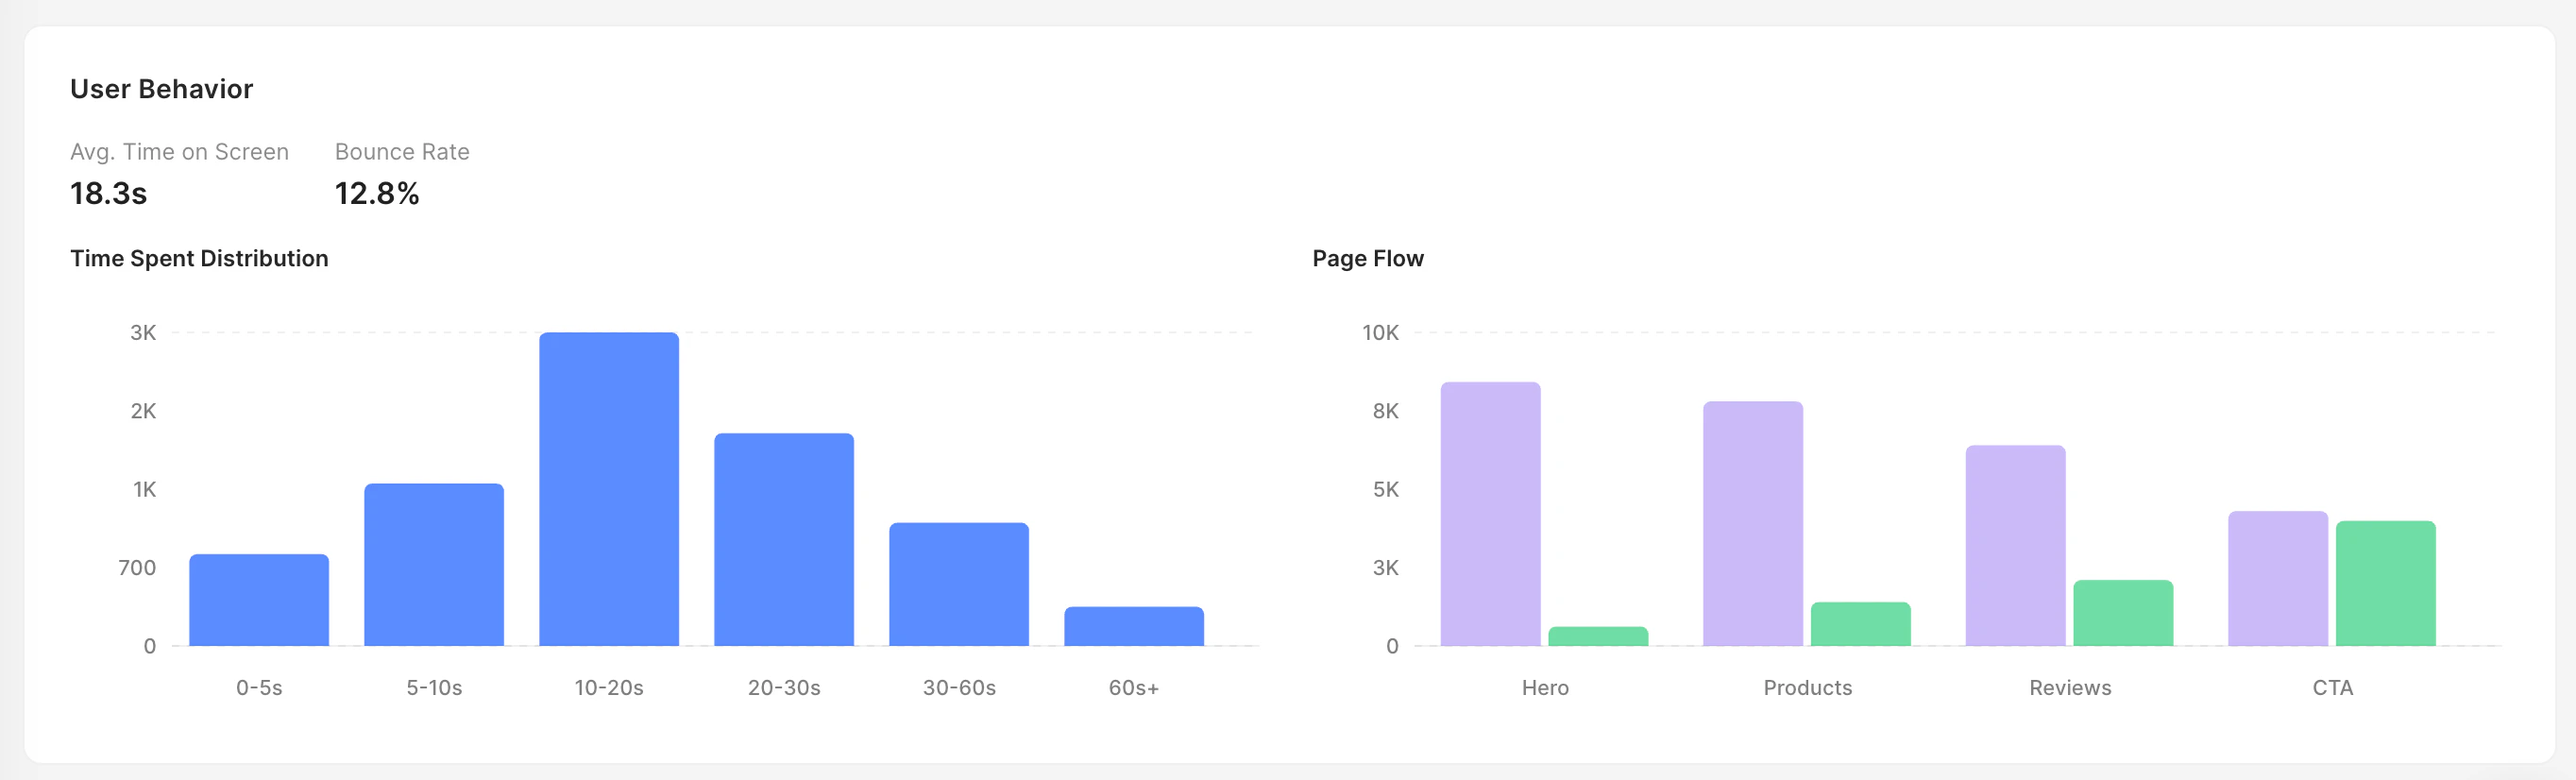
### User Behavior
Understand how users engage with your screen:
* **Avg. Time on Screen** — average session duration in seconds
* **Bounce Rate** — percentage of users who left without taking action
* **Time Spent Distribution** — a histogram showing how long users spend on the screen, grouped into time buckets
* **Page Flow** (multi-page screens only) — shows how users progress through pages, including progression percentage and exit rate per page
***
### User Behavior
Understand how users engage with your screen:
* **Avg. Time on Screen** — average session duration in seconds
* **Bounce Rate** — percentage of users who left without taking action
* **Time Spent Distribution** — a histogram showing how long users spend on the screen, grouped into time buckets
* **Page Flow** (multi-page screens only) — shows how users progress through pages, including progression percentage and exit rate per page
 ***
## Controls
All analytics views share a common set of controls:
* **Date range** — select a custom range or use presets (7d, 30d, 60d, 90d)
* **Time unit** — choose between Day, Week, or Month granularity
* **Chart type** — switch between Line, Area, and Vertical Bar charts
* **Metric switcher** — toggle which metric is displayed on charts
### Filters
Analytics filters are coming soon. You will be able to narrow down data by specific attributes such as country, product, and more.
***
[Success and Failure Actions](success-failure-actions)
[Using No-Codes with custom purchases handling](using-no-codes-with-custom-purchases-handling)
***
## Controls
All analytics views share a common set of controls:
* **Date range** — select a custom range or use presets (7d, 30d, 60d, 90d)
* **Time unit** — choose between Day, Week, or Month granularity
* **Chart type** — switch between Line, Area, and Vertical Bar charts
* **Metric switcher** — toggle which metric is displayed on charts
### Filters
Analytics filters are coming soon. You will be able to narrow down data by specific attributes such as country, product, and more.
***
[Success and Failure Actions](success-failure-actions)
[Using No-Codes with custom purchases handling](using-no-codes-with-custom-purchases-handling)