> ## Documentation Index
> Fetch the complete documentation index at: https://documentation.qonversion.io/llms.txt
> Use this file to discover all available pages before exploring further.
# Monitoring
> Real-time analytics for your mobile app with in-app subscriptions
The Qonversion Monitoring page is a customizable dashboard allowing you to track your app's critical metrics. You can choose which metrics to display, such as Sales, MRR, Active Subscriptions, New-User-to-Paid Conversion rate, and more, and arrange them in the order that makes the most sense for your needs. This lets you focus on the metrics that matter most to you and your team.
Plus, the dashboard is saved per user, so you can customize it to your preferences and needs rather than having a one-size-fits-all approach for your entire organization. This makes it easy to stay on top of your app's performance and make data-driven decisions tailored to your needs.
## Available metrics
You can add a widget with any metric that is present in the Qonversion Dashboard:
1. [New Users Overview](users#new-users-overview)
2. [New-User-to-Trial Conversion](users#new-user-to-trial-conversion)
3. [New-User-to-Paid Conversion](users#new-user-to-paid-conversion)
4. [Active Trials](trials#active-trials)
5. [New Trials](trials#new-trials)
6. [Trials Movement](trials#trials-movement)
7. [Trial-to-Paid Conversion](trials#trial-to-paid-conversion)
8. [Trials Cancellation Rate](trials#trials-cancellation-rate)
9. [Active Subscriptions](subscriptions#active-subscriptions)
10. [New Subscriptions](subscriptions#new-subscriptions)
11. [Subscriptions Movement](subscriptions#subscriptions-movement)
12. [Subscriptions Cancellation Rate](subscriptions#subscriptions-cancellation-rate)
13. [Sales](revenue#sales)
14. [Proceeds](revenue#proceeds)
15. [Refunds](revenue#refunds)
16. [Refund Rate](revenue#refund-rate)
17. [MRR](revenue#mrr)
18. [MRR Movement](revenue#mrr-movement)
19. [ARR](revenue#arr)
20. [ARR Movement](revenue#arr-movement)
21. [Events](events-analytics)
## How to set up
Qonversion Monitoring dashboard can be flexibly customized. We'll provide a step-by-step guide for:
* Adding widgets
* Configuring them to display the metrics that matter most to you
* Arranging the widgets in the order that makes the most sense for your needs.
### Adding widgets
To add a new widget to your dashboard
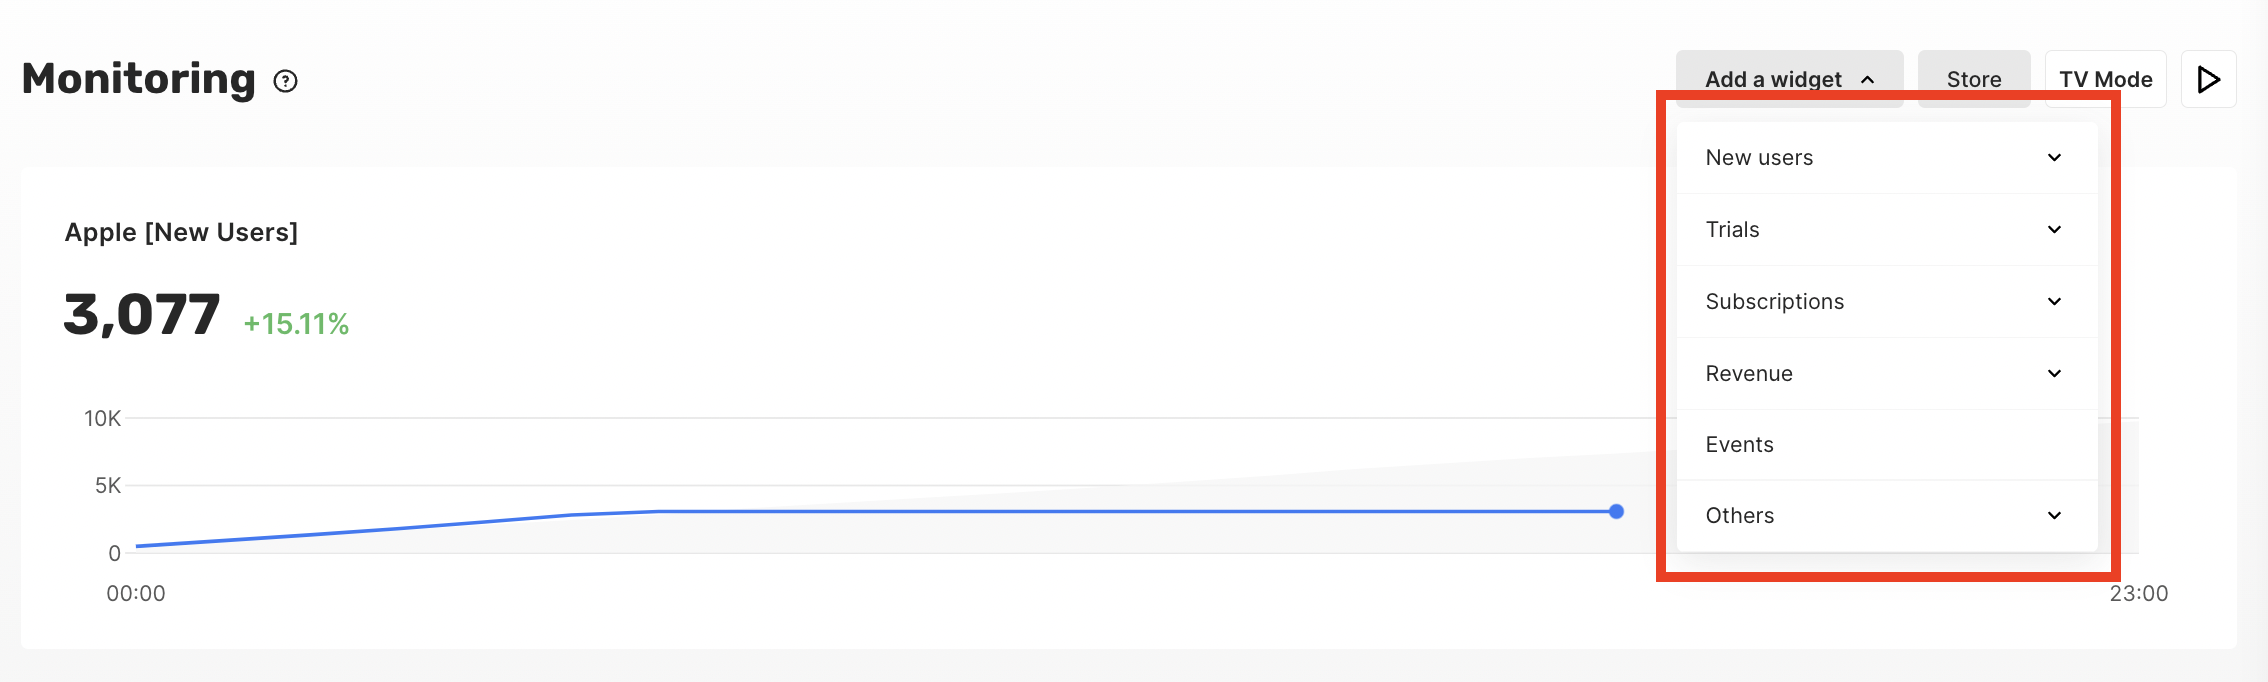
1. Click the Add a widget button 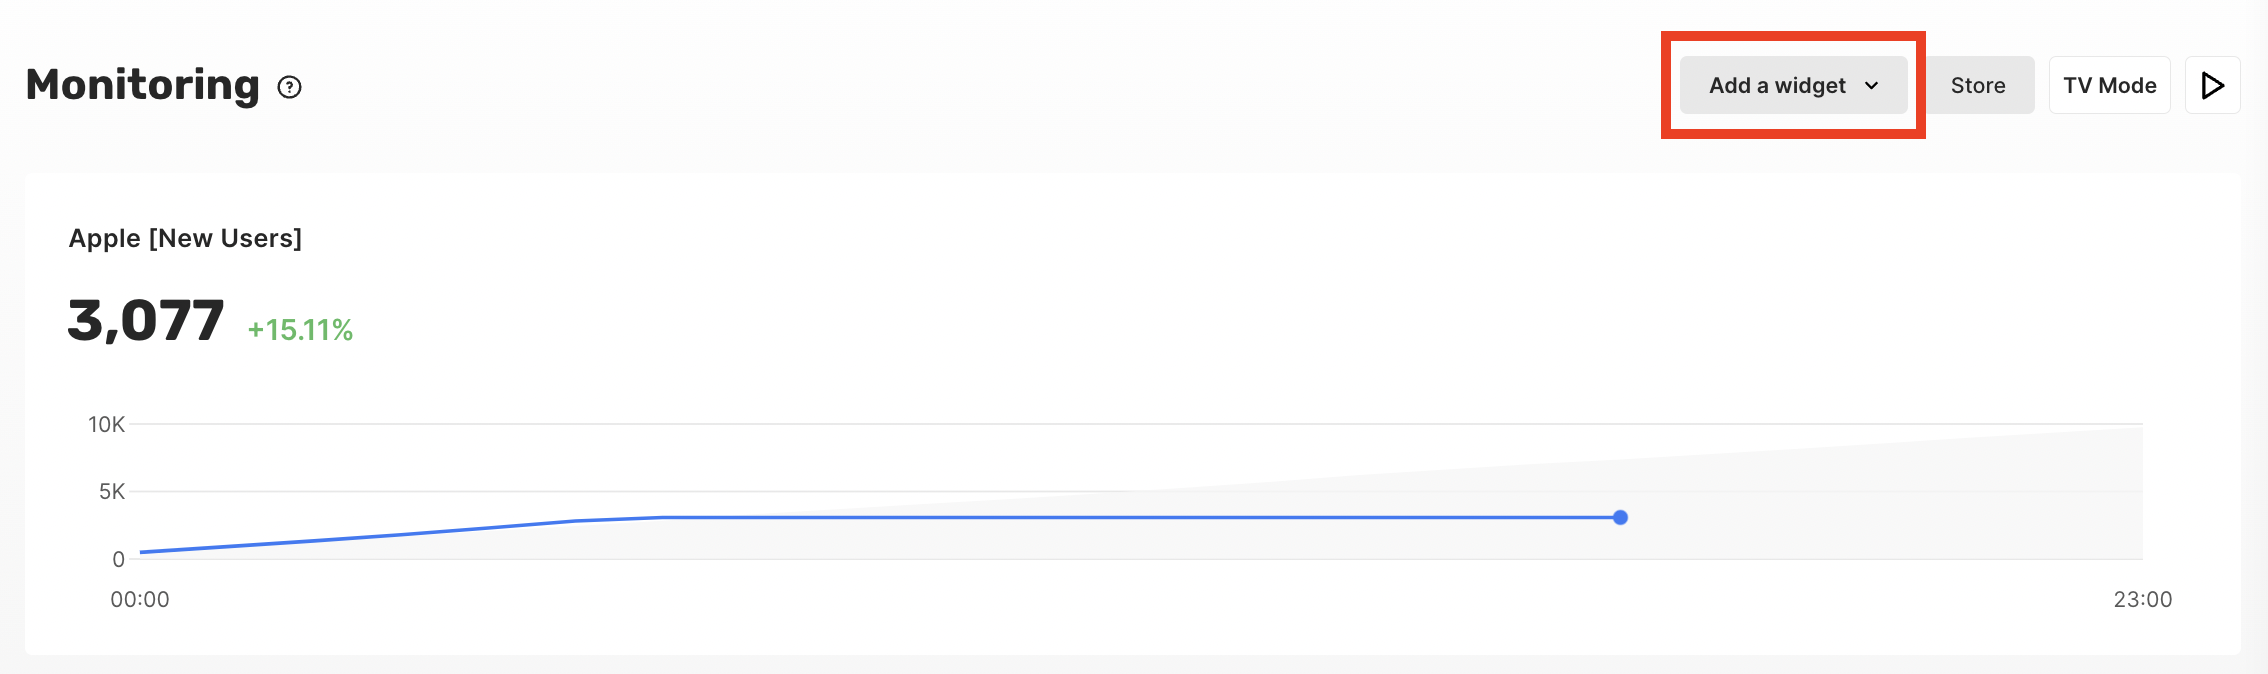 2. Choose one of the 21 available metrics from the drop-down menu.
  ### Configuring widgets
To configure a widget according to your needs:
1. Hover the widget's top right corner and click the settings button
### Configuring widgets
To configure a widget according to your needs:
1. Hover the widget's top right corner and click the settings button  2. Adjust any of the following attributes:
1. Metric to Display (one of the 21 available metrics)
2. Data format (cumulative or incremental)
3. Grouping option
4. Store filter
5. Period to display (from Current Day to Last Year)
6. Widget's Title
7. Chart Type
8. Chart Width
3. Click the Save button
2. Adjust any of the following attributes:
1. Metric to Display (one of the 21 available metrics)
2. Data format (cumulative or incremental)
3. Grouping option
4. Store filter
5. Period to display (from Current Day to Last Year)
6. Widget's Title
7. Chart Type
8. Chart Width
3. Click the Save button  ### Arranging widgets
To arrange widgets in the order that makes the most sense for your needs:
1. Hover the widget's top right corner and press the drag-n-drop button
### Arranging widgets
To arrange widgets in the order that makes the most sense for your needs:
1. Hover the widget's top right corner and press the drag-n-drop button 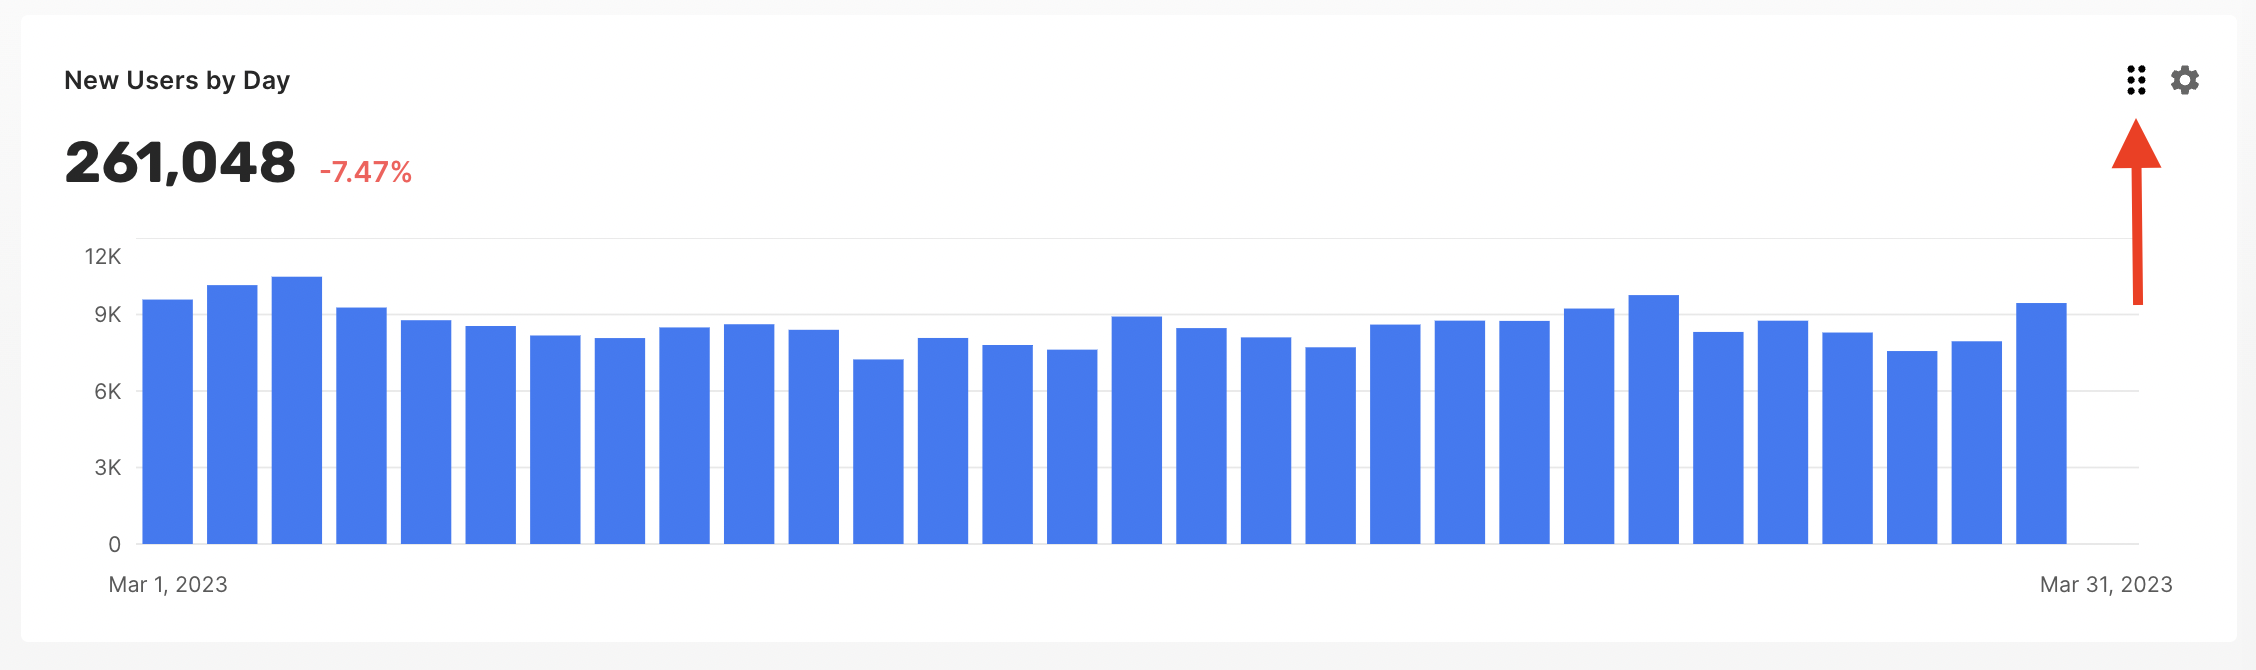 2. Place the widget in the desired place on the dashboard
3. Release the drag-n-drop button
## Cumulative Data Format
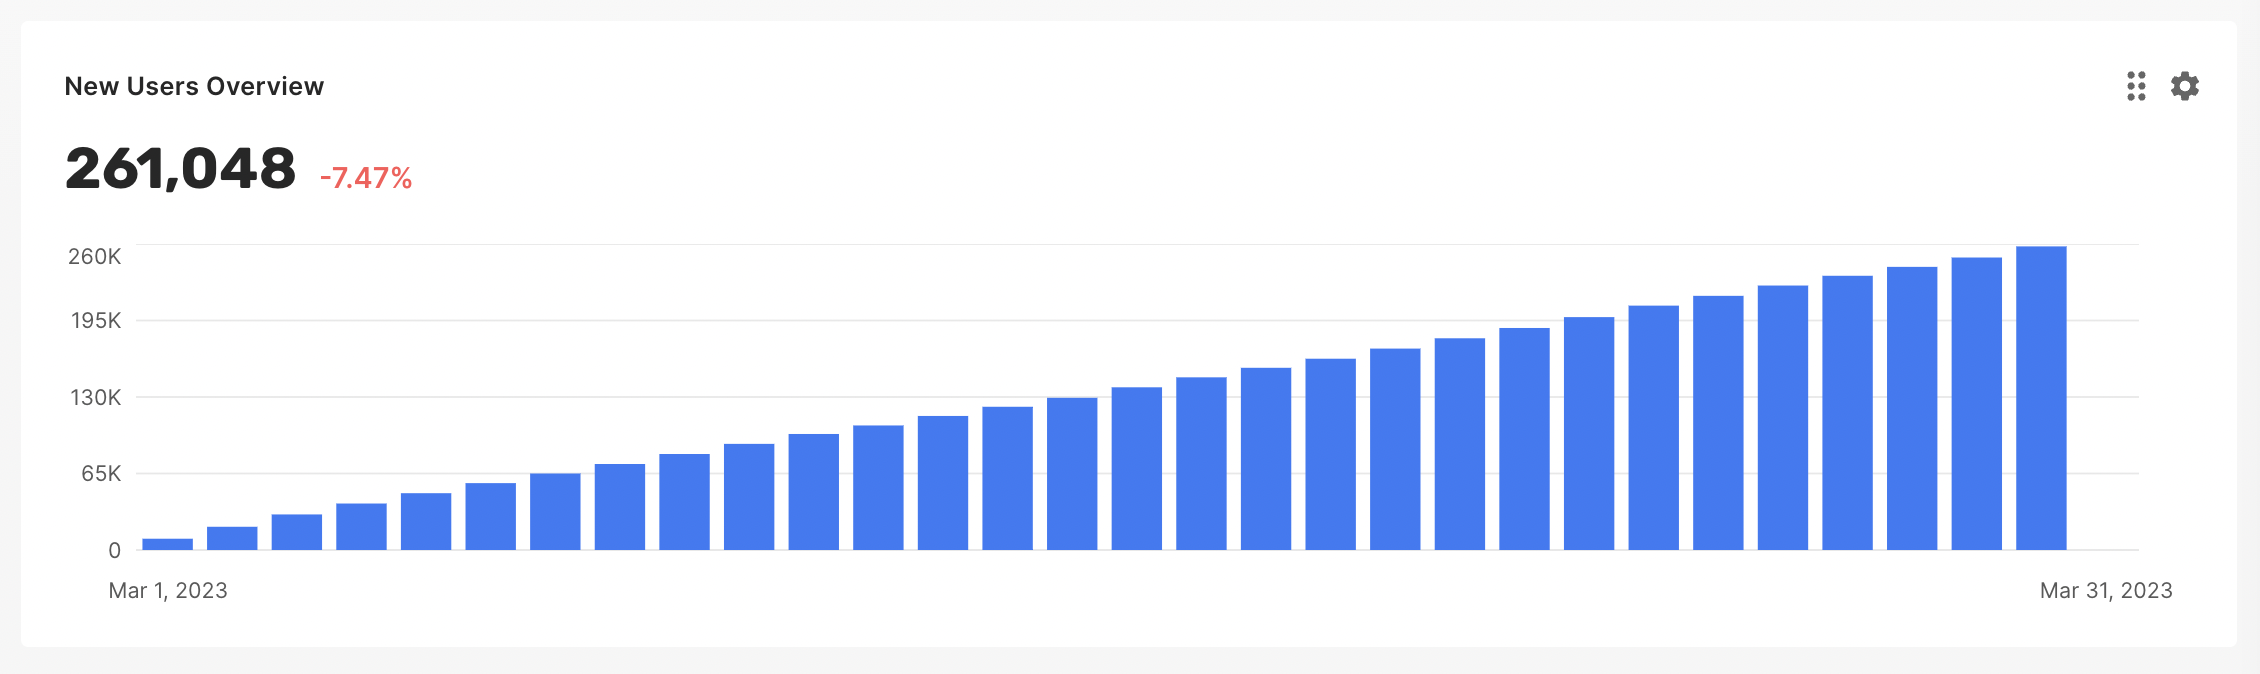
In the widget's settings, you can find an option to choose cumulative data format.
2. Place the widget in the desired place on the dashboard
3. Release the drag-n-drop button
## Cumulative Data Format
In the widget's settings, you can find an option to choose cumulative data format.
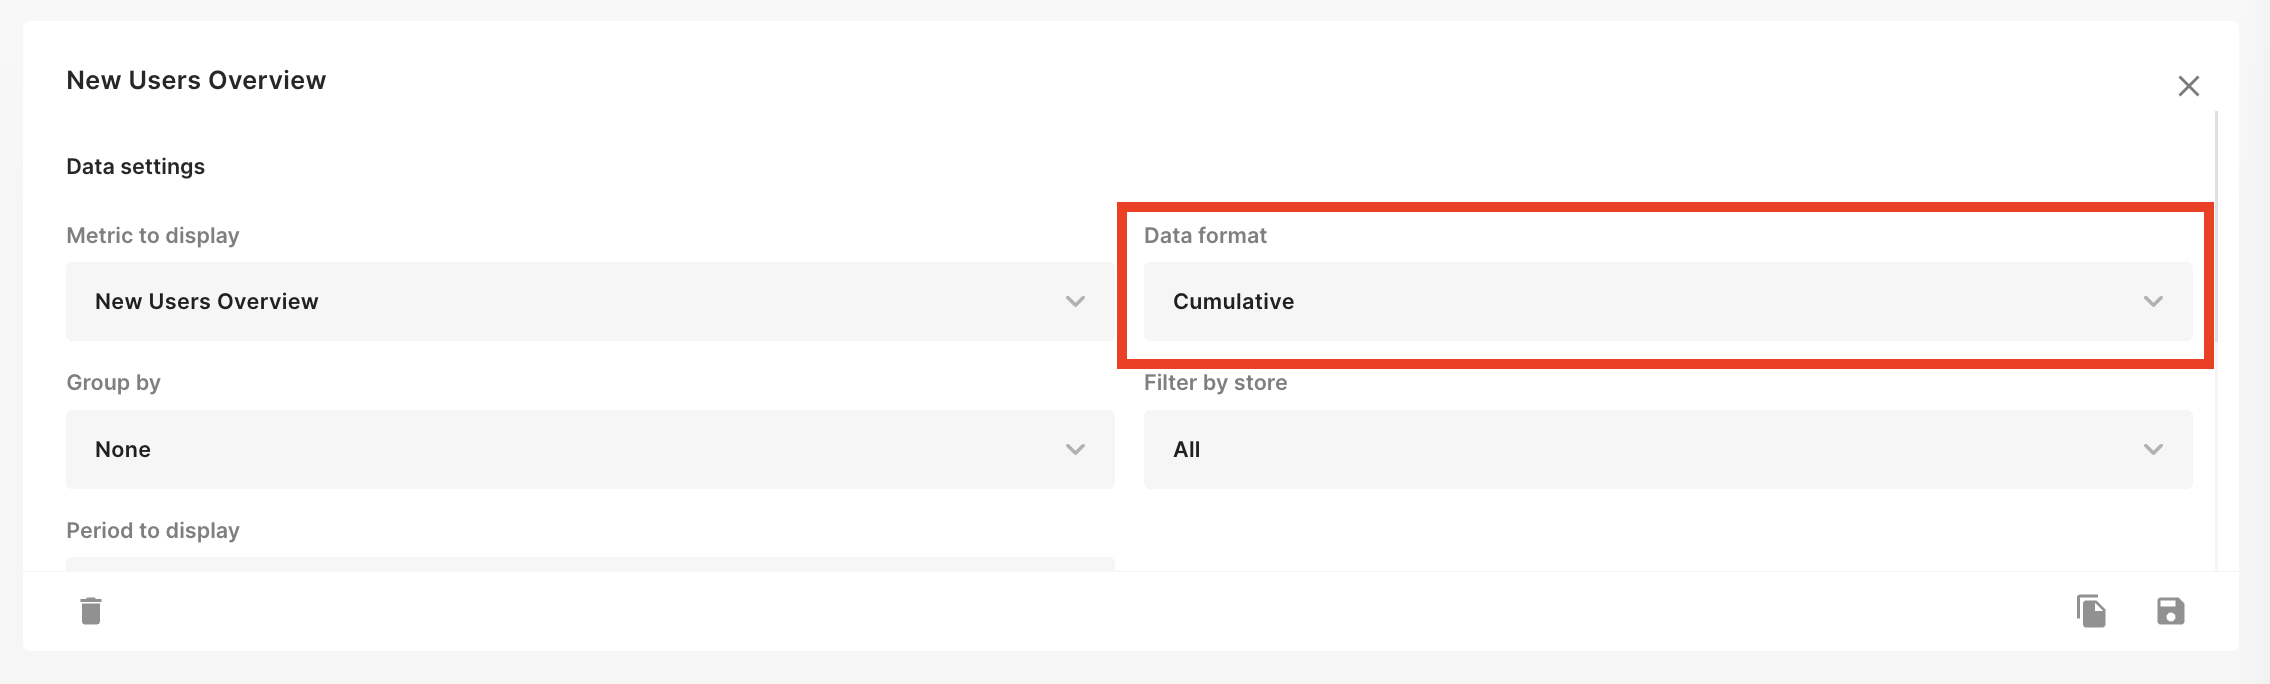 Once you have activated the cumulative data format, each data point starts representing the total for that metric up to that point in time rather than just the value for that specific period.
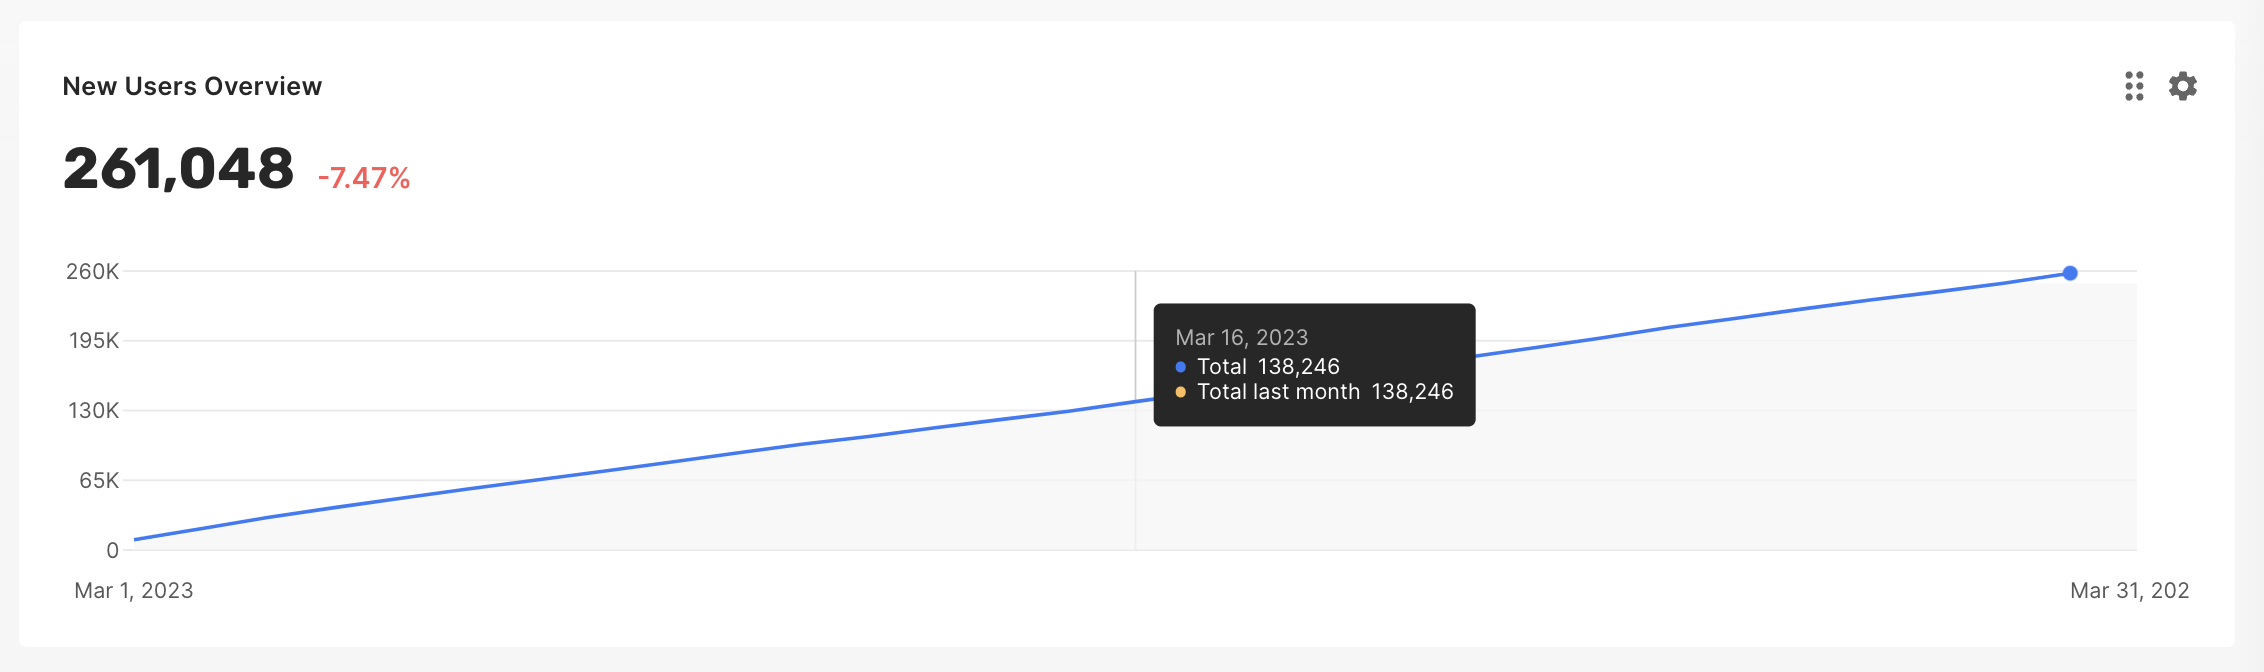
 Additionally, after choosing the **Line** chart type, the widget displays data of the same length from the previous period. Please note that this feature works only for the following period to display: Current Day, Current Week, Current Month, and Current Year.
 ## Percentages explained
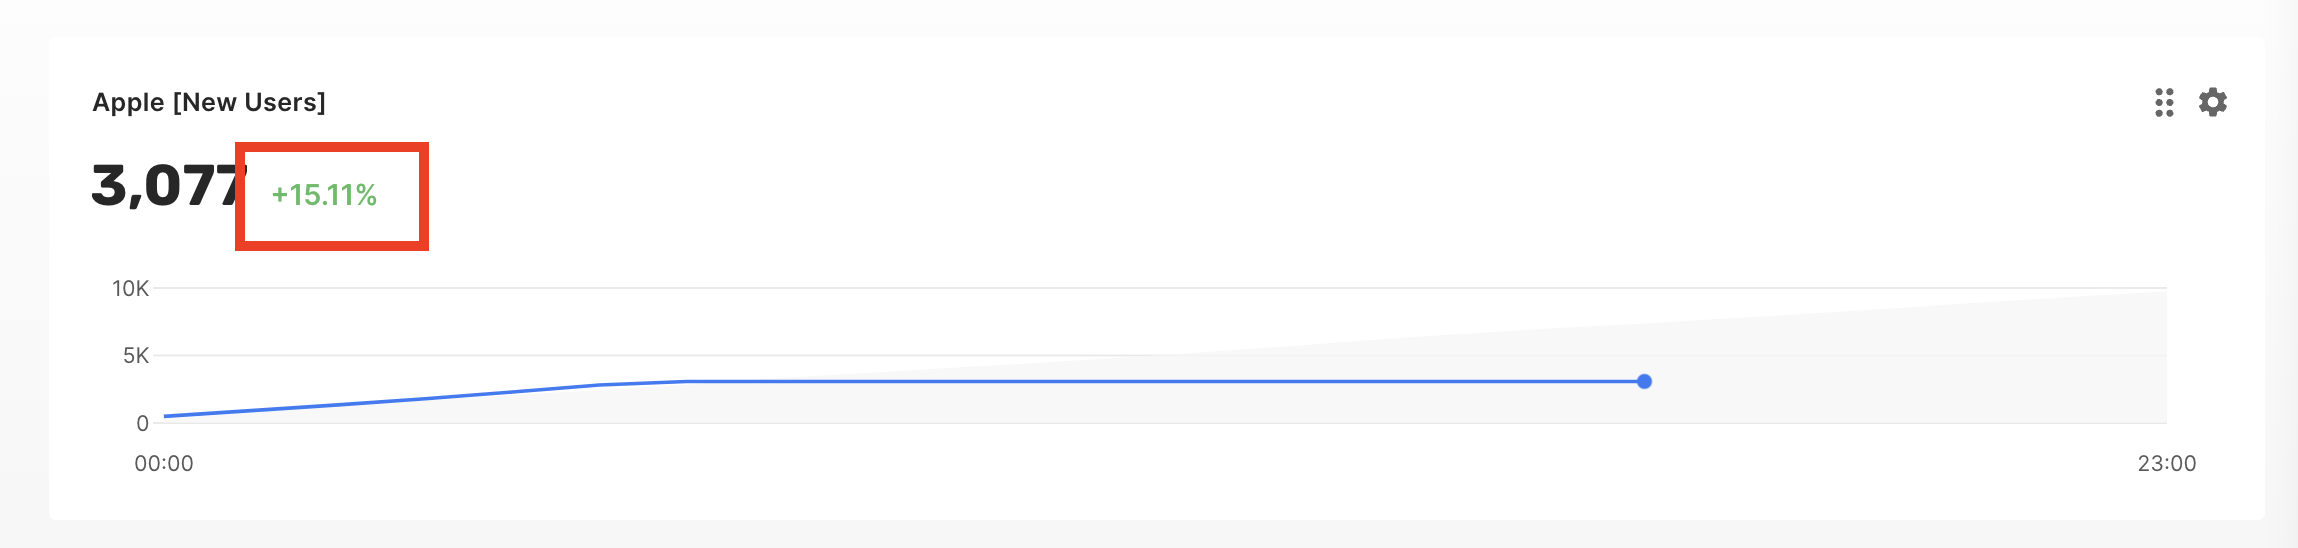 One of the features of the dashboard charts is the percentage-based comparison with the previous period of the same length. The value is calculated by following steps:
1. We take the chart's value (a number which is located to the left of the percentage)
2. Compare the value with the one calculated accordingly to the widget's period to display setting:
1. Current day -> The same day the previous week until the current time
2. Current week -> Previous week until the current time
3. Current month -> Previous month until the current time
4. Current year -> Previous year until the current time
5. Last day -> 24 hours before "last day"
6. Last week - > A week before "last week"
7. Last month -> A month before "last month"
8. Last year -> A year before "last year"
## Additional Features
### TV Mode
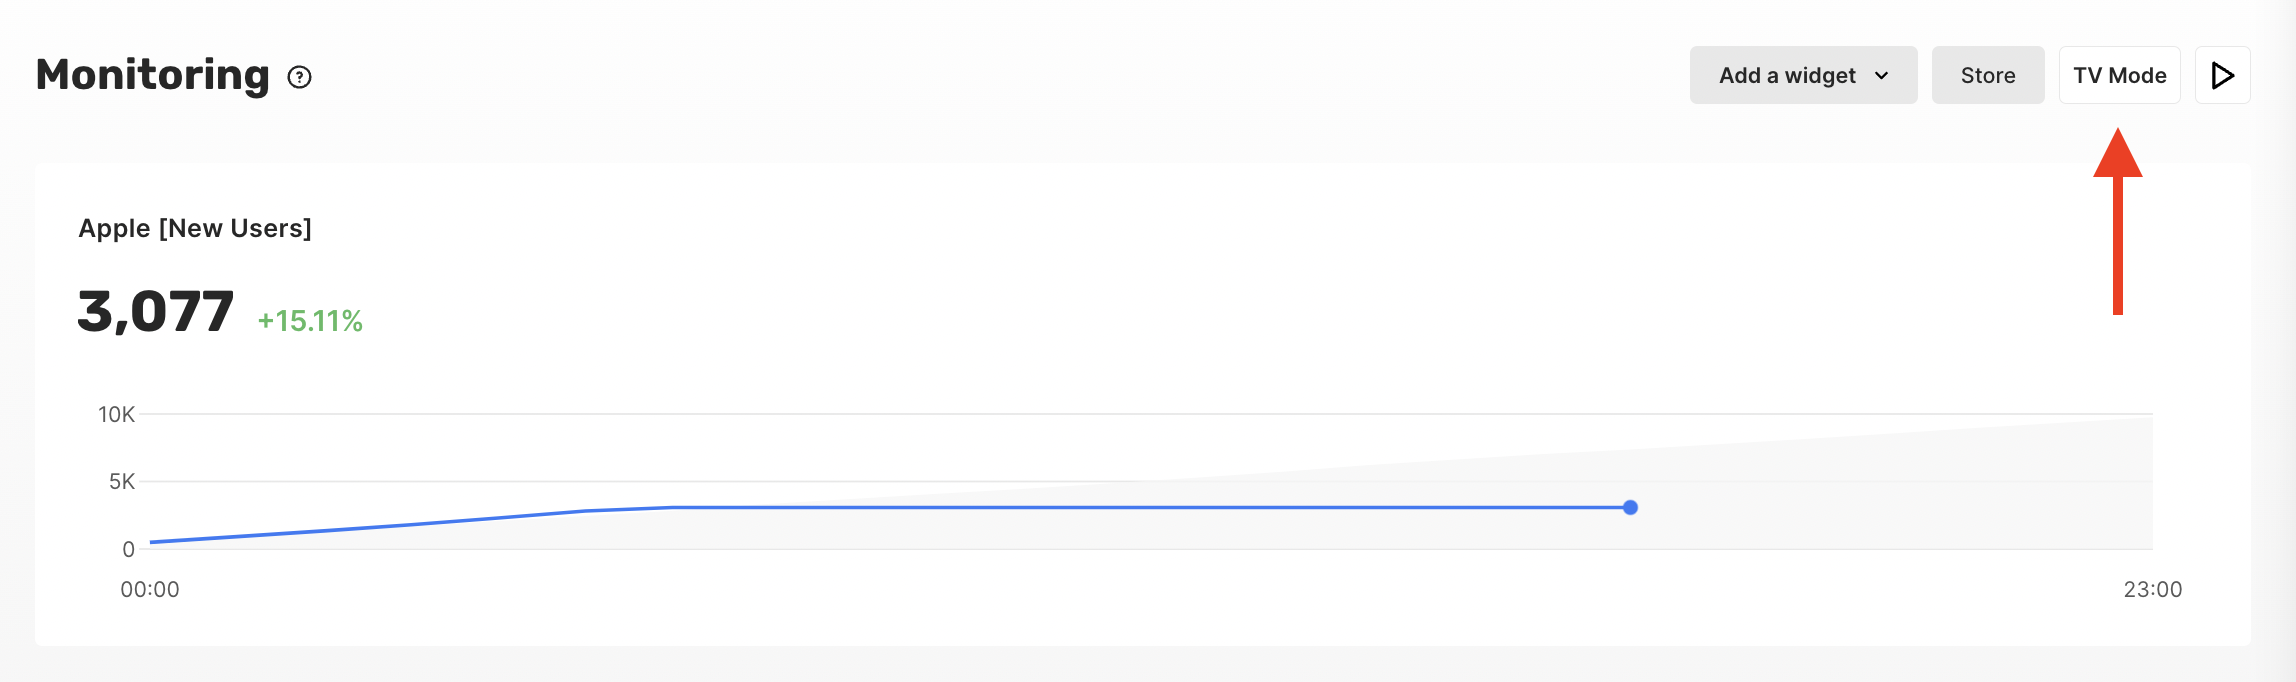
TV Mode allows you to view the monitoring dashboard in full-screen mode.
One of the features of the dashboard charts is the percentage-based comparison with the previous period of the same length. The value is calculated by following steps:
1. We take the chart's value (a number which is located to the left of the percentage)
2. Compare the value with the one calculated accordingly to the widget's period to display setting:
1. Current day -> The same day the previous week until the current time
2. Current week -> Previous week until the current time
3. Current month -> Previous month until the current time
4. Current year -> Previous year until the current time
5. Last day -> 24 hours before "last day"
6. Last week - > A week before "last week"
7. Last month -> A month before "last month"
8. Last year -> A year before "last year"
## Additional Features
### TV Mode
TV Mode allows you to view the monitoring dashboard in full-screen mode.
 ### Real-time updates
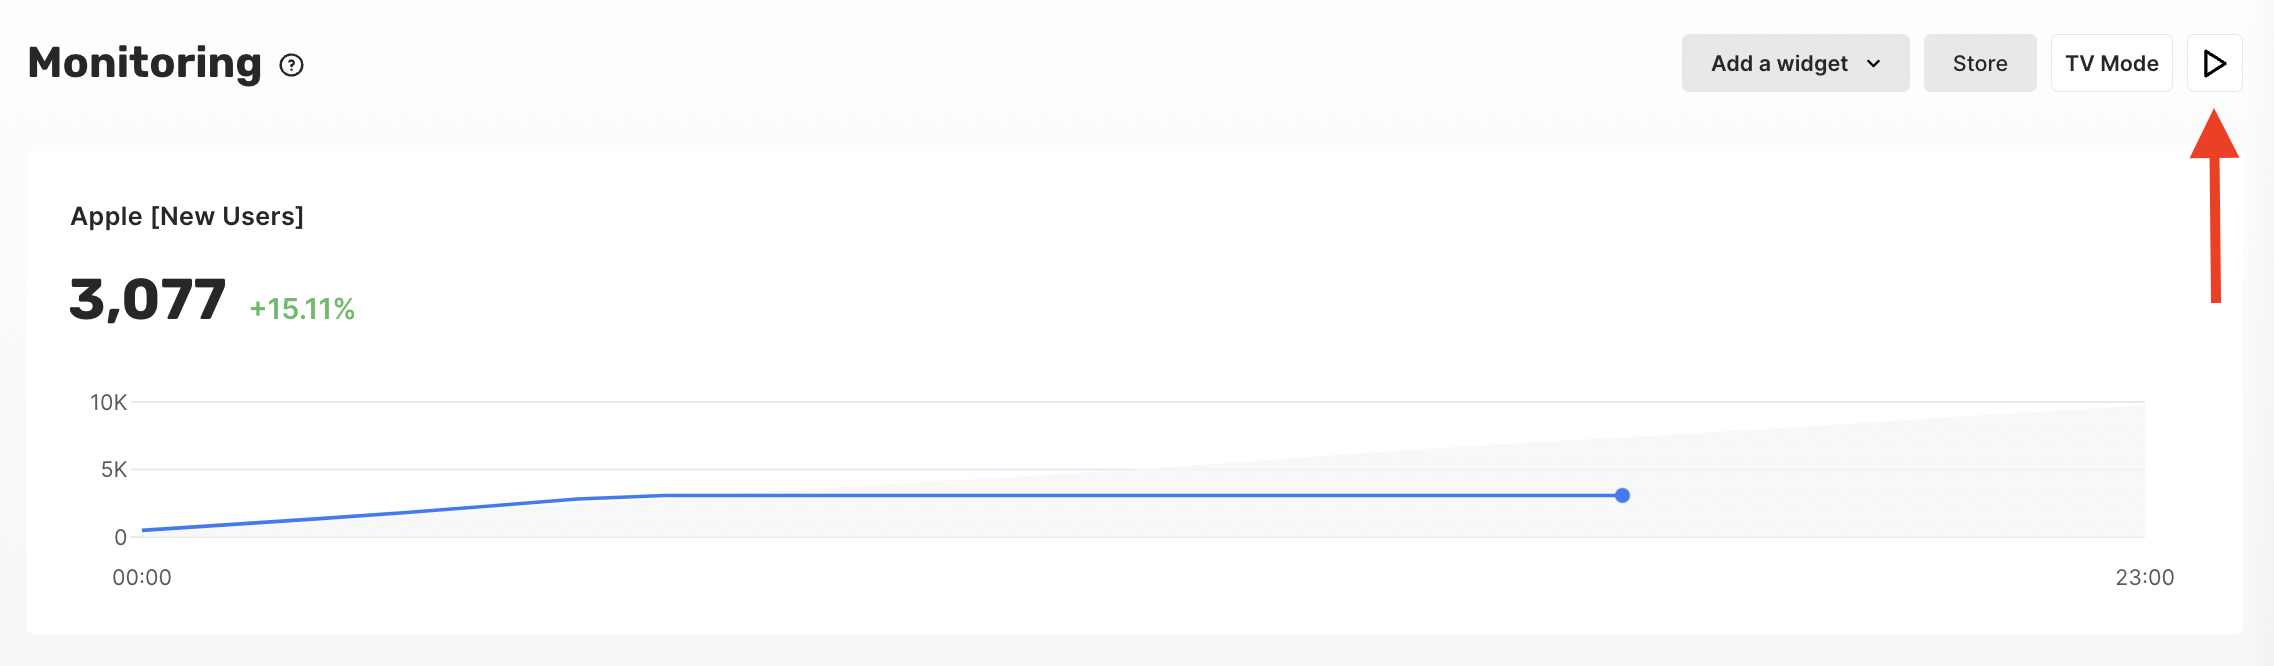
You can enable real-time updates in the monitoring dashboard to analyze your metrics in real-time. The data is updated every minute.
### Real-time updates
You can enable real-time updates in the monitoring dashboard to analyze your metrics in real-time. The data is updated every minute.
 ***
[Analytics](analytics)
[Revenue](revenue)
***
[Analytics](analytics)
[Revenue](revenue)