> ## Documentation Index
> Fetch the complete documentation index at: https://documentation.qonversion.io/llms.txt
> Use this file to discover all available pages before exploring further.
# Monitoring (Real-Time)
> Real-time analytics for your mobile app with in-app subscriptions
## Available metrics
1. Trials started: The number of trials started today
2. Subscriptions started: The number of subscriptions started today
3. Non-renewing purchases: The number of one time in-app purchases made today
4. Tracked revenue: Today's revenue of your app (before app stores' commission) tracked by Qonversion
 > 📘 Note
>
> The percentages displayed next to the data show the difference between the current day and the same day of the previous week.
## Available Charts
### Daily users
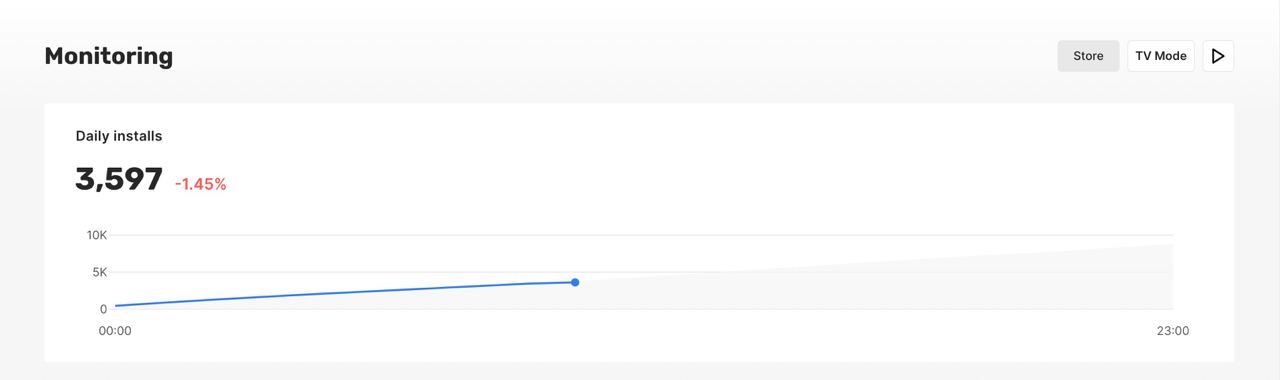
Calculated as a cumulative number of new users that opened your app for the first time today.
> 📘 Note
>
> The percentages displayed next to the data show the difference between the current day and the same day of the previous week.
## Available Charts
### Daily users
Calculated as a cumulative number of new users that opened your app for the first time today.
 ### Trials by hour
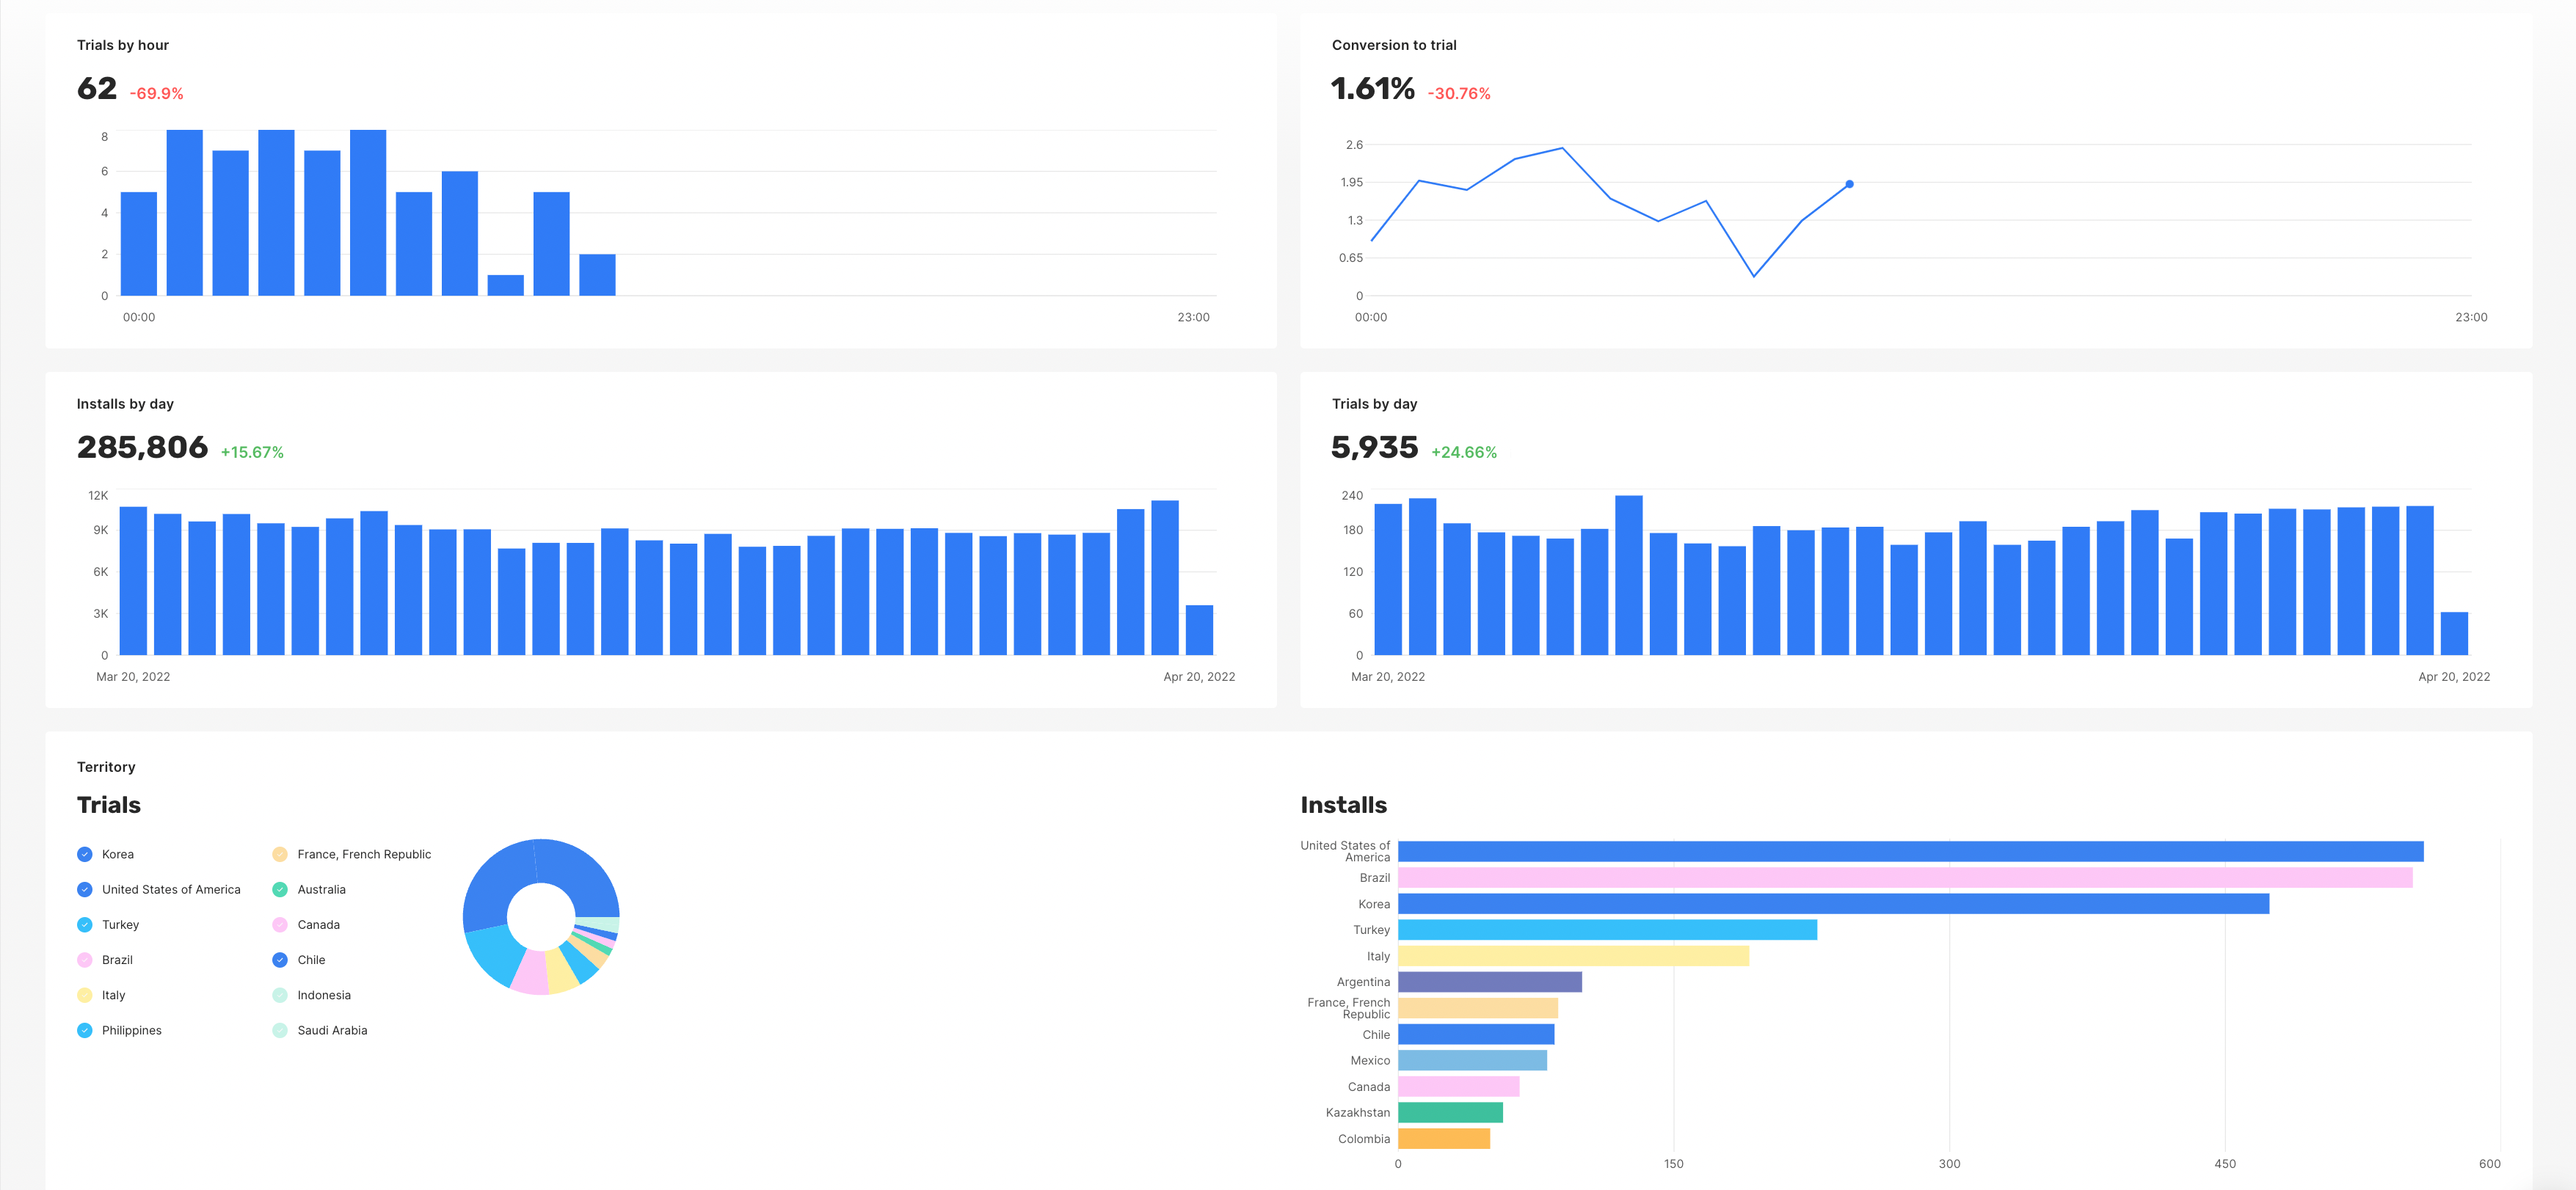
Calculated as the number of the Trial Started events today.
### Conversion to trial
The conversion is calculated as today's number of trials divided by today's number of new users.
### Users by day
The number of new users who opened your app daily during the month.
### Trials by day
The number of the Trial Started events in your app each day during the month.
### Territory. Trials.
The number of the Trial Started events today is segmented by country.
### Territory. Installs.
The number of new users detected today by Qonversion SDK for the first time segmented by country.
### Trials by hour
Calculated as the number of the Trial Started events today.
### Conversion to trial
The conversion is calculated as today's number of trials divided by today's number of new users.
### Users by day
The number of new users who opened your app daily during the month.
### Trials by day
The number of the Trial Started events in your app each day during the month.
### Territory. Trials.
The number of the Trial Started events today is segmented by country.
### Territory. Installs.
The number of new users detected today by Qonversion SDK for the first time segmented by country.
 ## Features
### TV Mode
TV Mode allows you to view the monitoring dashboard in the full-screen mode.
### Real-time updates
You can enable real-time updates in the monitoring dashboard to analyze your metrics in real-time. The data is updated every minute.
## Features
### TV Mode
TV Mode allows you to view the monitoring dashboard in the full-screen mode.
### Real-time updates
You can enable real-time updates in the monitoring dashboard to analyze your metrics in real-time. The data is updated every minute.