> ## Documentation Index
> Fetch the complete documentation index at: https://documentation.qonversion.io/llms.txt
> Use this file to discover all available pages before exploring further.
# Analytics
> In-app subscription analytics
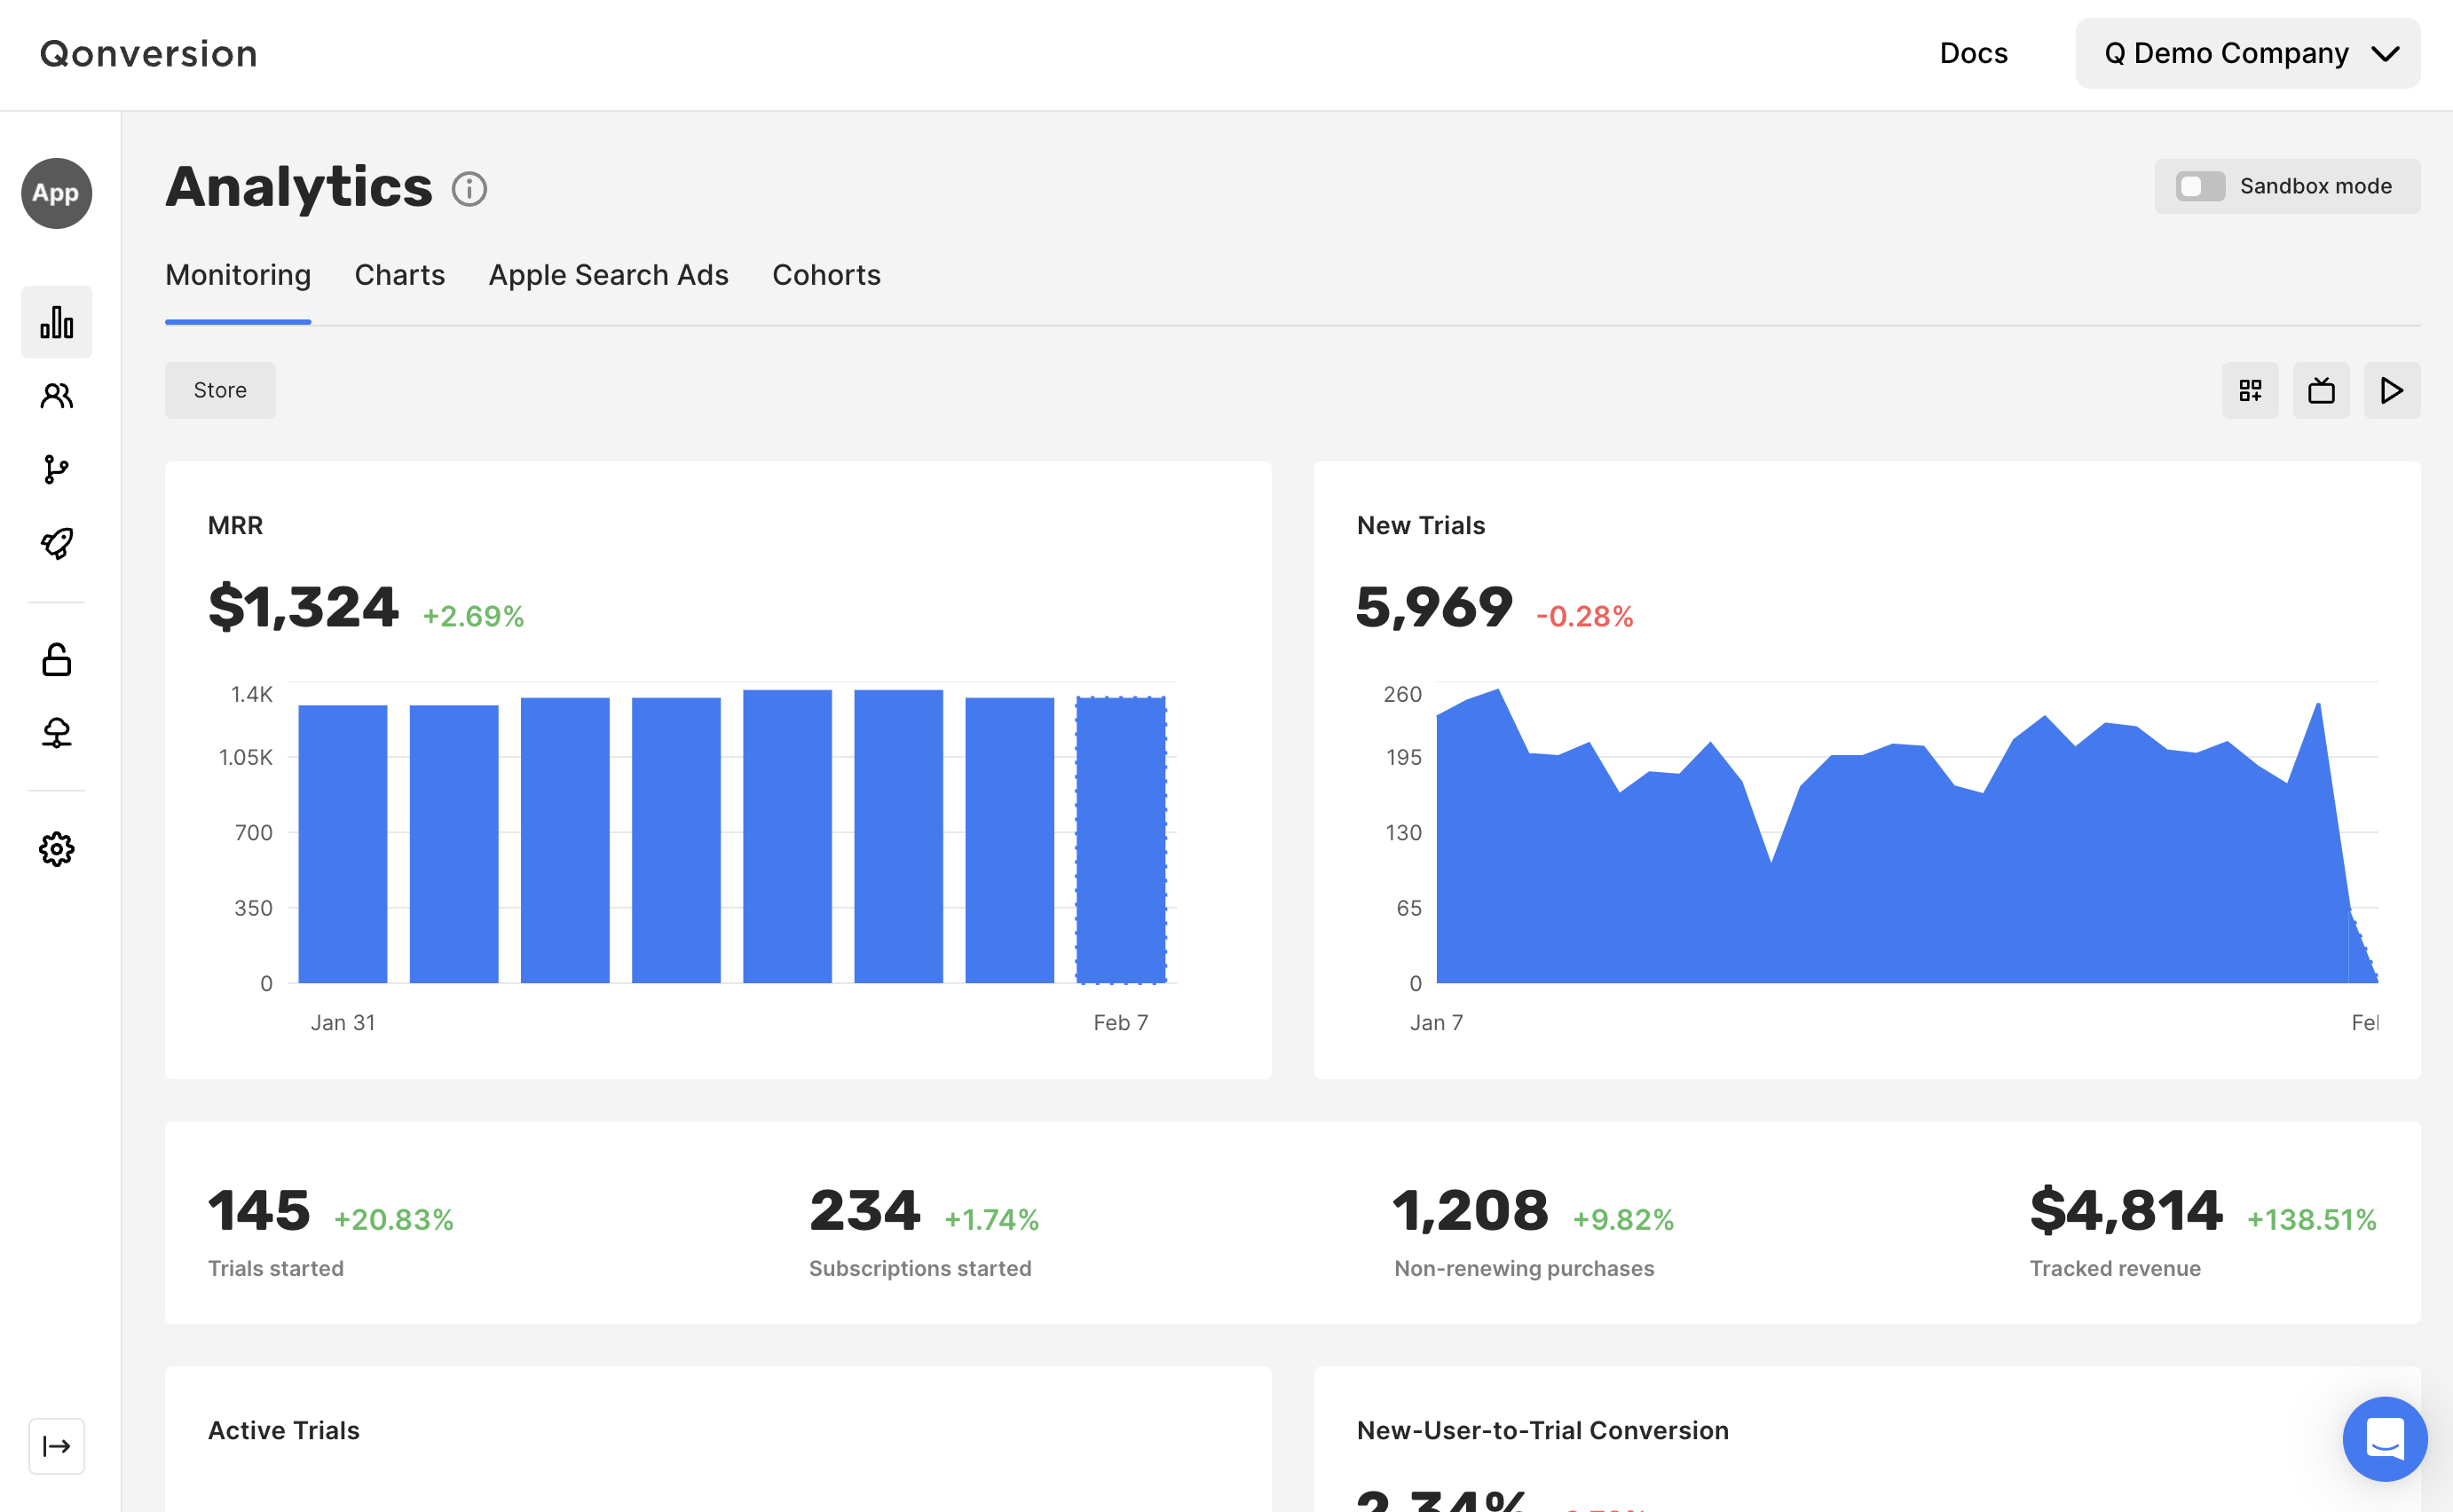 ## Overview
Note that all data is stored and represented in UTC time zone.
To gain comprehensive insights into specific Dashboards, we recommend looking into the following guides for detailed information:
* [Monitoring](monitoring)
* [New User Overview](users#new-users-overview)
* [New-User-to-Trial Conversion](users#new-user-to-trial-conversion)
* [New-User-to-Paid Conversion](users#new-user-to-paid-conversion)
* [Active Trials](trials#active-trials)
* [New Trials](trials#new-trials)
* [Trials Movement](trials#trials-movement)
* [Trial-to-Paid Conversion](trials#trial-to-paid-conversion)
* [Trial Cancellation Rate](trials#trial-cancellation-rate)
* [Active Subscriptions](subscriptions#active-subscriptions)
* [New Subscriptions](subscriptions#new-subscriptions)
* [Subscriptions Movement](subscriptions#subscriptions-movement)
* [Subscriptions Cancellation Rate](subscriptions#subscriptions-cancellation-rate)
* [Sales](revenue#sales)
* [Proceeds](revenue#proceeds)
* [ARPU](revenue#arpu)
* [ARPPU](revenue#arppu)
* [Refunds](revenue#refunds)
* [Refund Rate](revenue#refund-rate)
* [MRR](revenue#mrr)
* [MRR Movement](revenue#mrr-movement)
* [ARR](revenue#arr)
* [ARR Movement](revenue#arr-movement)
* [Events](events-analytics)
* [Cohorts](cohorts)
* [Customers](customers)
* [Apple Search Ads](apple-search-ads-analytics)
* [Screen Analytics](no-codes-analytics)
***
## Filters and Groups
Filters enable you to narrow down charts to display data that aligns with specific attributes. This feature is handy when examining the performance of particular properties, such as a specific country, currency or app version.
On the other hand, groups allow you to dissect the overall totals in Analytics charts into distinct data segments. This functionality proves valuable when comparing the performance of specific properties.
### Available attributes
| Attribute | Description |
| ------------------ | ----------------------------------------------------------------------------------------------------------------------------------------------------------- |
| Revenue event | This filter organises data based on revenue events: **Trial Converted, Subscription Started, Subscription Renewed, Subscription Refunded, In-App Purchase** |
| Country | This filter organises data based on the recorded device locale |
| Product | This filter organises data based on the Product ID in the App Stores |
| Currency | This filter organises data based on the currency in which the purchase was made |
| Locale | This filter organises data based on the Device language |
| Device | This filter organises data based on the Device type |
| Device ID | This filter organises data based on the Device ID (identifierForVendor or Settings Secure Android ID) |
| OS version | This filter organises data based on the OS version |
| App version | This filter organises data based on the Application version |
| SDK version | This filter organises data based on the SDK version |
| Custom User ID | This filter organises data based on the Custom User ID, which is set with [setProperty](user-properties) method |
| Qonversion User ID | This filter organises data based on the User ID generated by Qonversion |
| Media Source | This filter organises data based on the Attribution Media Source (Apple Search Ads) |
| Campaign | This filter organises data based on the ASA Campaign |
| Ad set | This filter organises data based on the set of ASA advertising offers |
| Ad | This filter organises data based on the ASA advertising offer |
***
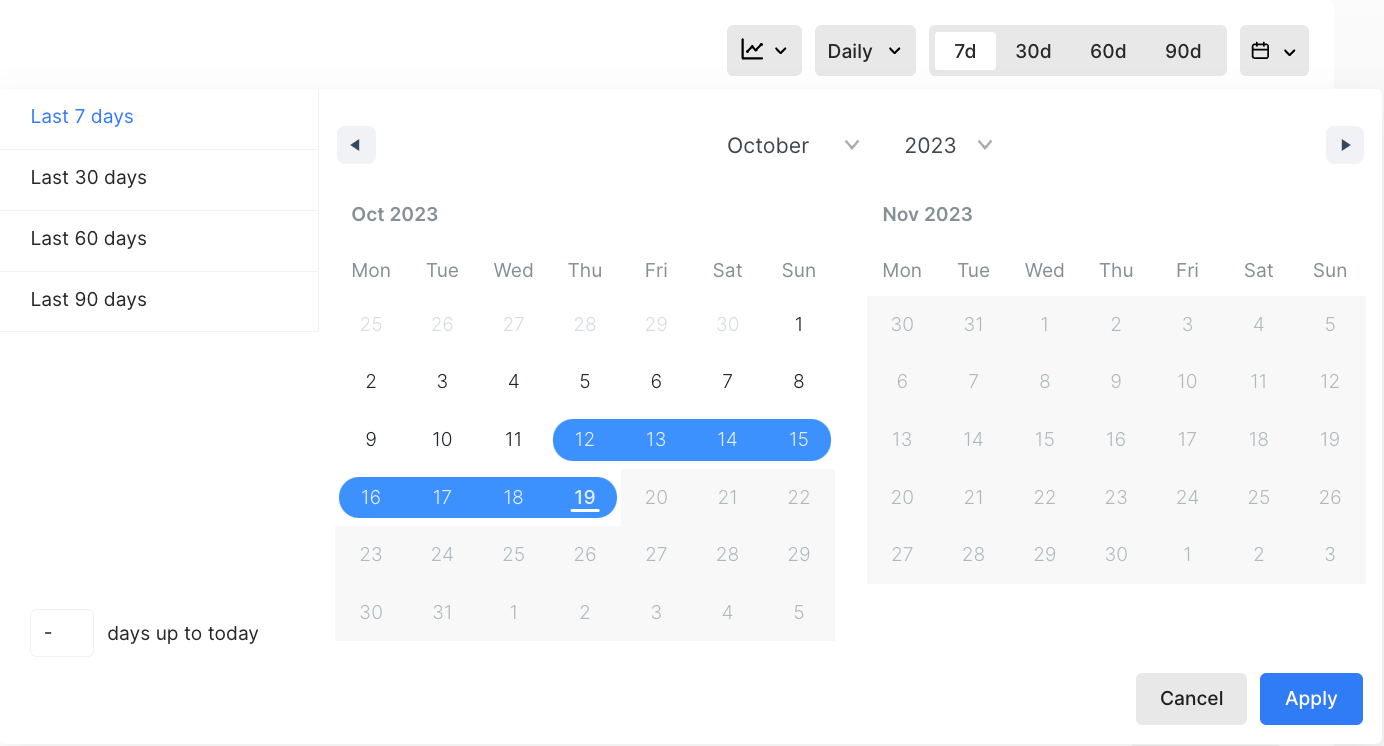
## Date Range
Choose the date range or custom amount of days up to the current day you want to analyse.
## Overview
Note that all data is stored and represented in UTC time zone.
To gain comprehensive insights into specific Dashboards, we recommend looking into the following guides for detailed information:
* [Monitoring](monitoring)
* [New User Overview](users#new-users-overview)
* [New-User-to-Trial Conversion](users#new-user-to-trial-conversion)
* [New-User-to-Paid Conversion](users#new-user-to-paid-conversion)
* [Active Trials](trials#active-trials)
* [New Trials](trials#new-trials)
* [Trials Movement](trials#trials-movement)
* [Trial-to-Paid Conversion](trials#trial-to-paid-conversion)
* [Trial Cancellation Rate](trials#trial-cancellation-rate)
* [Active Subscriptions](subscriptions#active-subscriptions)
* [New Subscriptions](subscriptions#new-subscriptions)
* [Subscriptions Movement](subscriptions#subscriptions-movement)
* [Subscriptions Cancellation Rate](subscriptions#subscriptions-cancellation-rate)
* [Sales](revenue#sales)
* [Proceeds](revenue#proceeds)
* [ARPU](revenue#arpu)
* [ARPPU](revenue#arppu)
* [Refunds](revenue#refunds)
* [Refund Rate](revenue#refund-rate)
* [MRR](revenue#mrr)
* [MRR Movement](revenue#mrr-movement)
* [ARR](revenue#arr)
* [ARR Movement](revenue#arr-movement)
* [Events](events-analytics)
* [Cohorts](cohorts)
* [Customers](customers)
* [Apple Search Ads](apple-search-ads-analytics)
* [Screen Analytics](no-codes-analytics)
***
## Filters and Groups
Filters enable you to narrow down charts to display data that aligns with specific attributes. This feature is handy when examining the performance of particular properties, such as a specific country, currency or app version.
On the other hand, groups allow you to dissect the overall totals in Analytics charts into distinct data segments. This functionality proves valuable when comparing the performance of specific properties.
### Available attributes
| Attribute | Description |
| ------------------ | ----------------------------------------------------------------------------------------------------------------------------------------------------------- |
| Revenue event | This filter organises data based on revenue events: **Trial Converted, Subscription Started, Subscription Renewed, Subscription Refunded, In-App Purchase** |
| Country | This filter organises data based on the recorded device locale |
| Product | This filter organises data based on the Product ID in the App Stores |
| Currency | This filter organises data based on the currency in which the purchase was made |
| Locale | This filter organises data based on the Device language |
| Device | This filter organises data based on the Device type |
| Device ID | This filter organises data based on the Device ID (identifierForVendor or Settings Secure Android ID) |
| OS version | This filter organises data based on the OS version |
| App version | This filter organises data based on the Application version |
| SDK version | This filter organises data based on the SDK version |
| Custom User ID | This filter organises data based on the Custom User ID, which is set with [setProperty](user-properties) method |
| Qonversion User ID | This filter organises data based on the User ID generated by Qonversion |
| Media Source | This filter organises data based on the Attribution Media Source (Apple Search Ads) |
| Campaign | This filter organises data based on the ASA Campaign |
| Ad set | This filter organises data based on the set of ASA advertising offers |
| Ad | This filter organises data based on the ASA advertising offer |
***
## Date Range
Choose the date range or custom amount of days up to the current day you want to analyse.
 ***
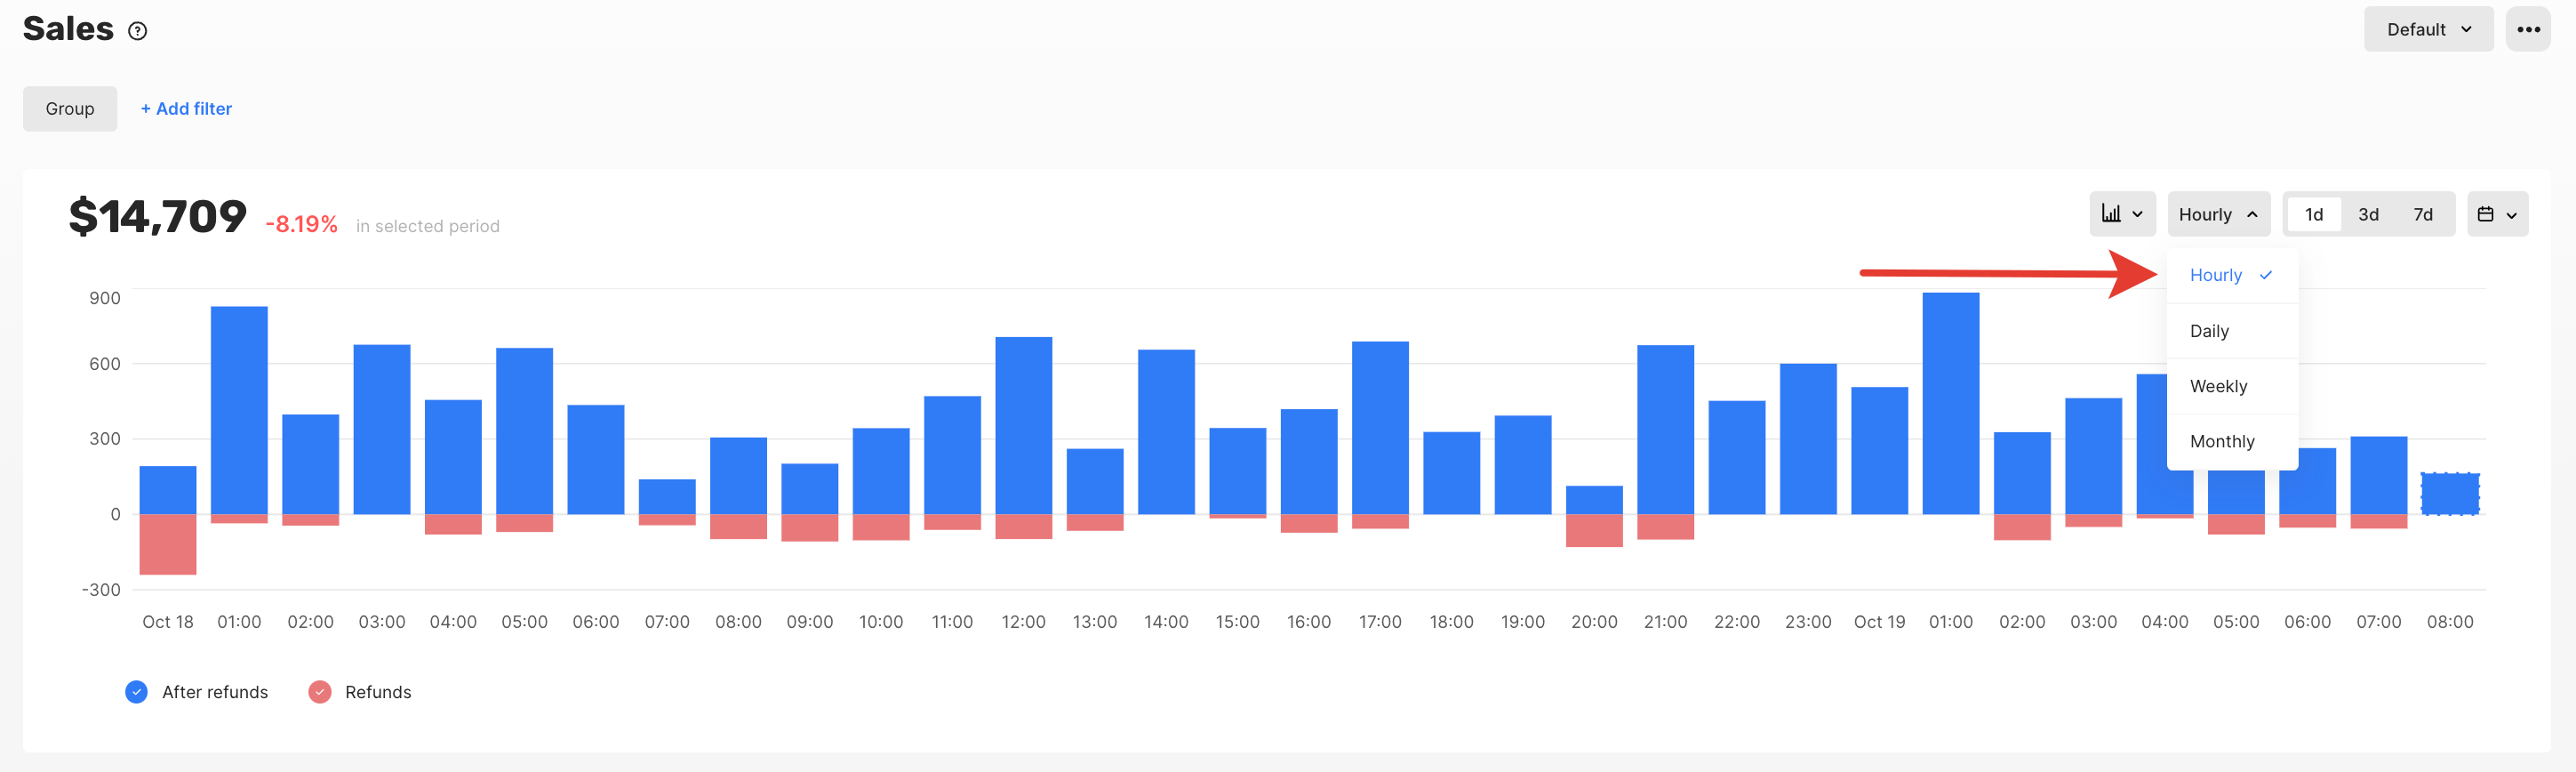
## Time Scale
Select the time scale for the x-axis of the charts. Opt for a day timescale to observe data at the finest level of detail. At the same time, lower resolutions like month allow you to identify broader trends over a longer period.
***
## Time Scale
Select the time scale for the x-axis of the charts. Opt for a day timescale to observe data at the finest level of detail. At the same time, lower resolutions like month allow you to identify broader trends over a longer period.
 ***
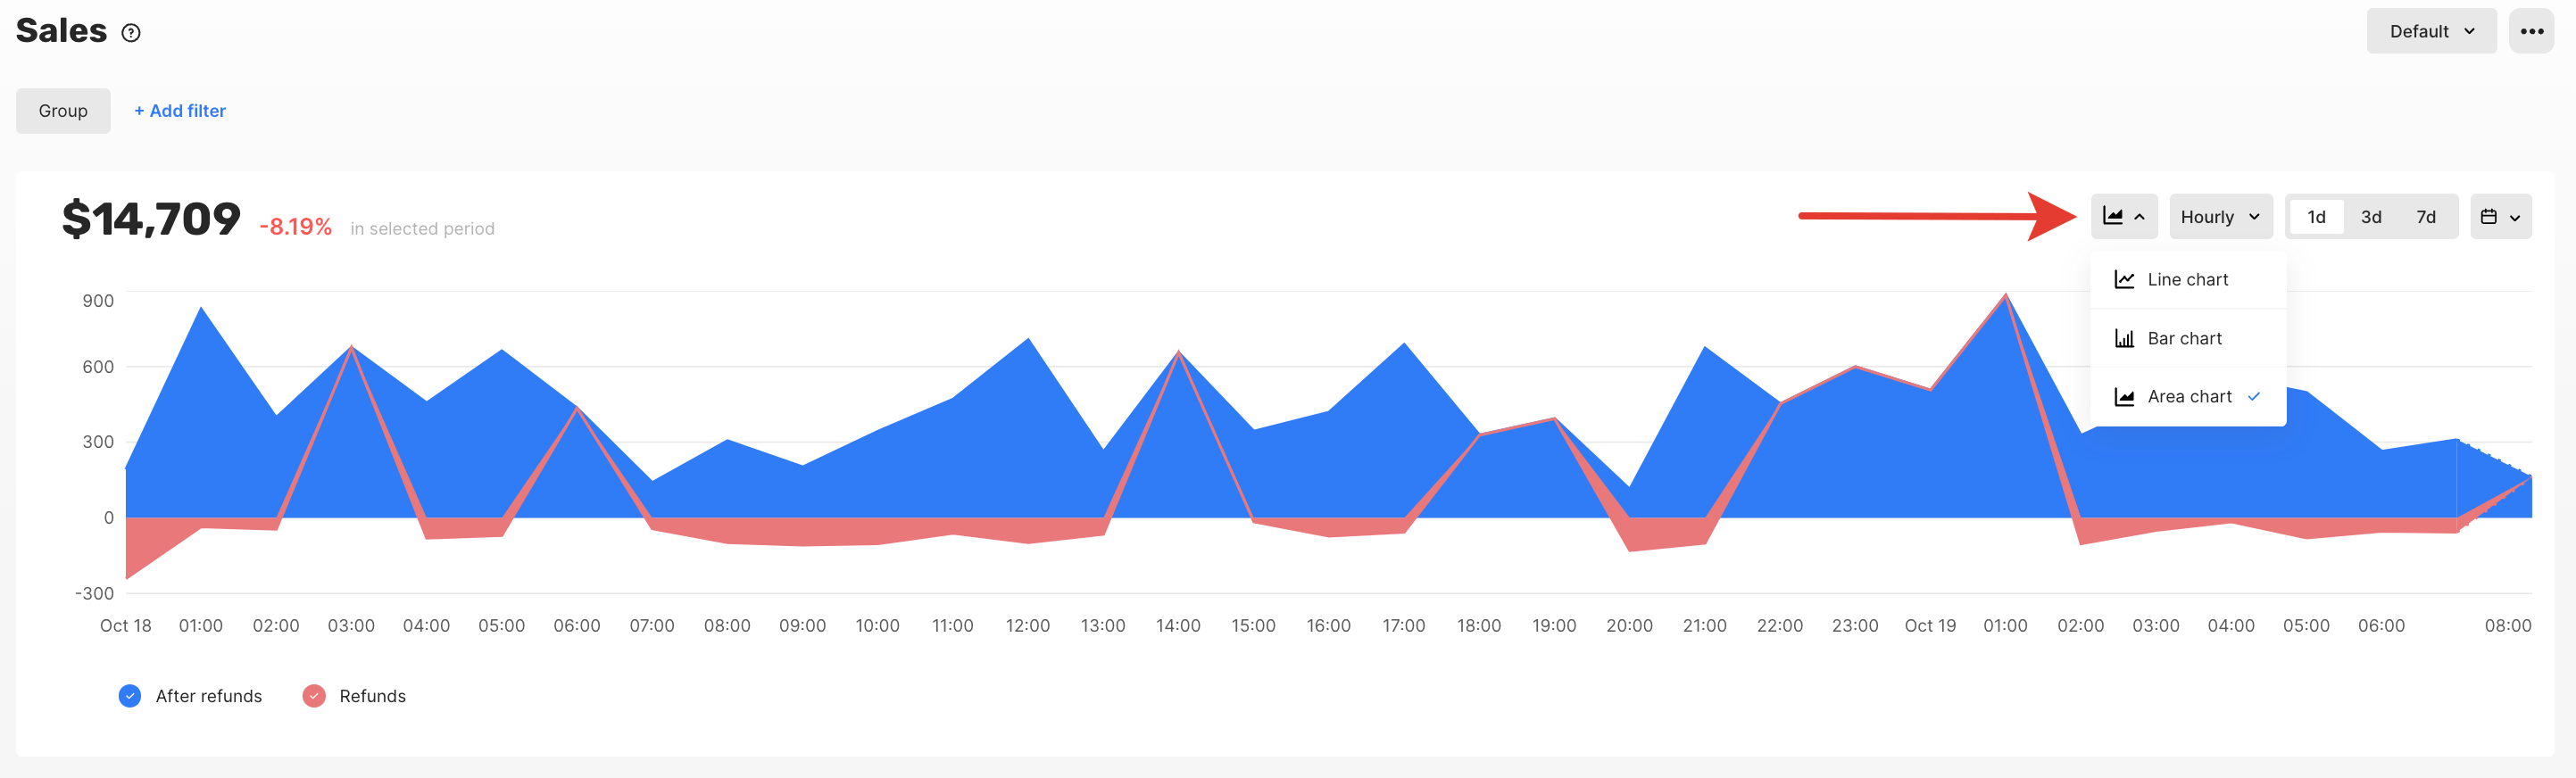
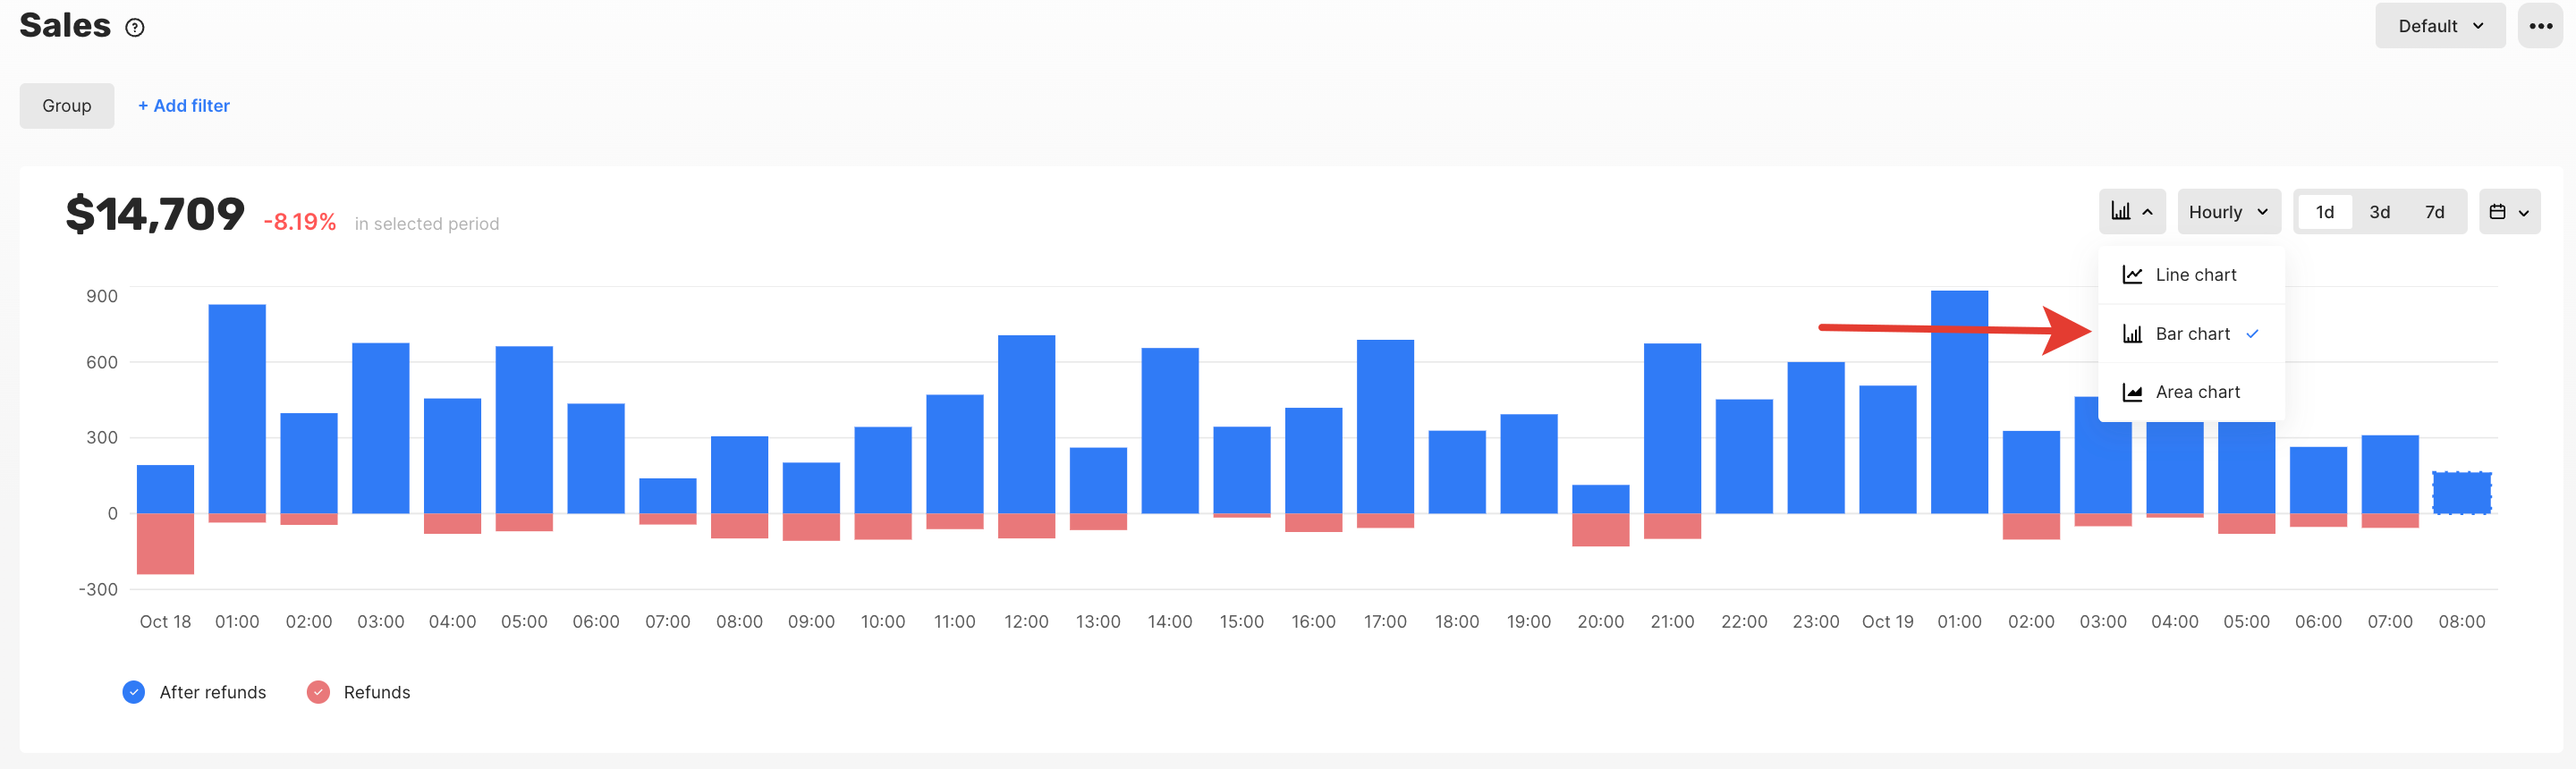
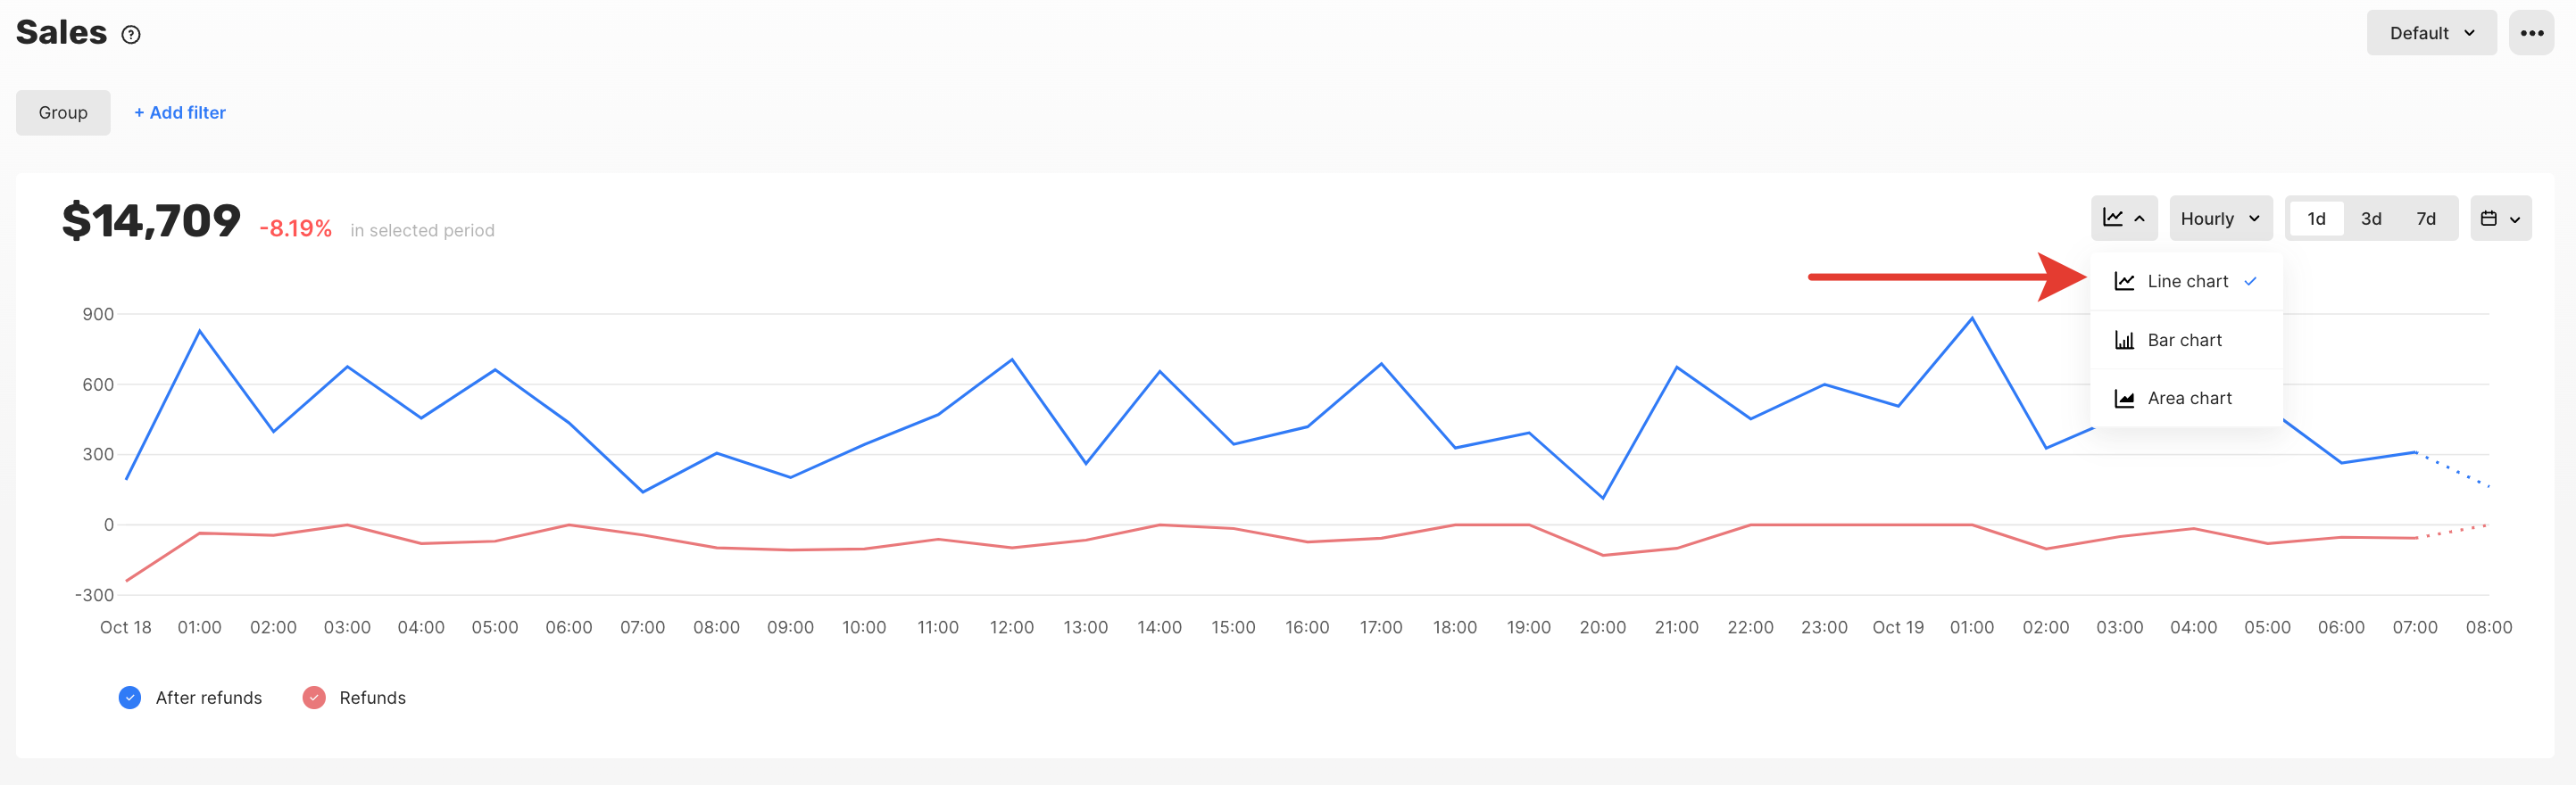
## Chart View
You can choose the chart view that best suits your data analysis needs, whether you prefer line charts, bar charts or any other type of chart.
***
## Chart View
You can choose the chart view that best suits your data analysis needs, whether you prefer line charts, bar charts or any other type of chart.
 ***
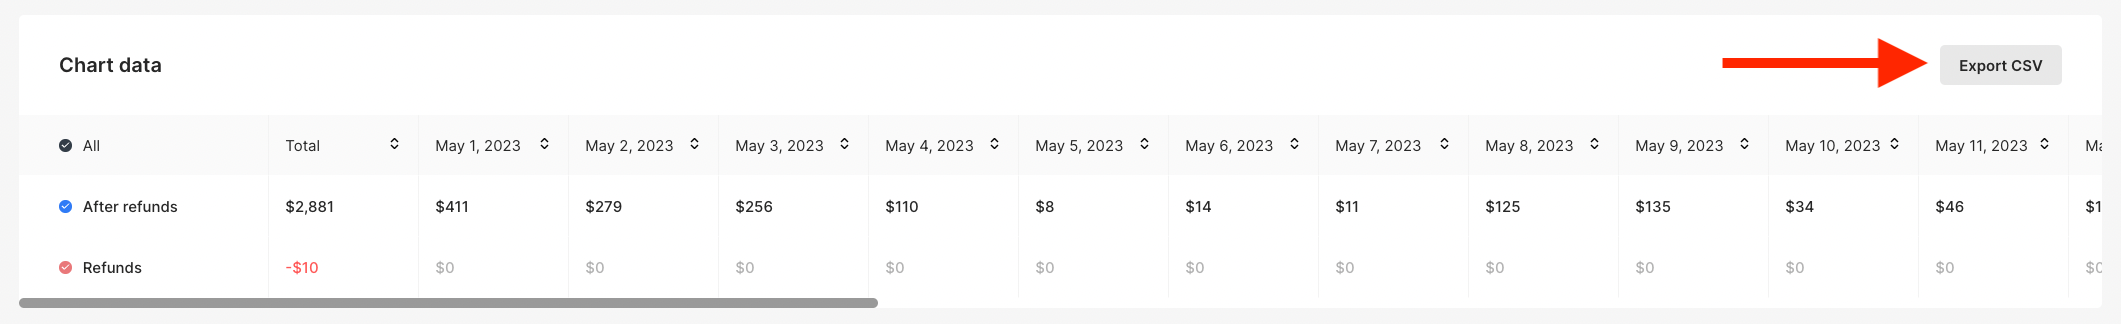
## Export CSV
To export chart data, navigate to the desired chart in the Qonversion dashboard, locate the "Export CSV" button below the chart, and click on it.
***
## Export CSV
To export chart data, navigate to the desired chart in the Qonversion dashboard, locate the "Export CSV" button below the chart, and click on it.
 ## Currency Conversion
Qonversion uses currency conversion on the date of purchase. All rates come from [fixer.io](https://fixer.io) - Open-Source API for current and historical foreign exchange rates published by the European Central Bank.
## Display Currency
Charts that contain monetary data display values in USD by default. You can choose a different currency to view the data in. Values are converted using exchange rates matching the date of each data point.
Your currency preference is saved and persists across sessions.
***
[Apple Ads Integration](apple-search-ads)
[Monitoring](monitoring)
## Currency Conversion
Qonversion uses currency conversion on the date of purchase. All rates come from [fixer.io](https://fixer.io) - Open-Source API for current and historical foreign exchange rates published by the European Central Bank.
## Display Currency
Charts that contain monetary data display values in USD by default. You can choose a different currency to view the data in. Values are converted using exchange rates matching the date of each data point.
Your currency preference is saved and persists across sessions.
***
[Apple Ads Integration](apple-search-ads)
[Monitoring](monitoring)